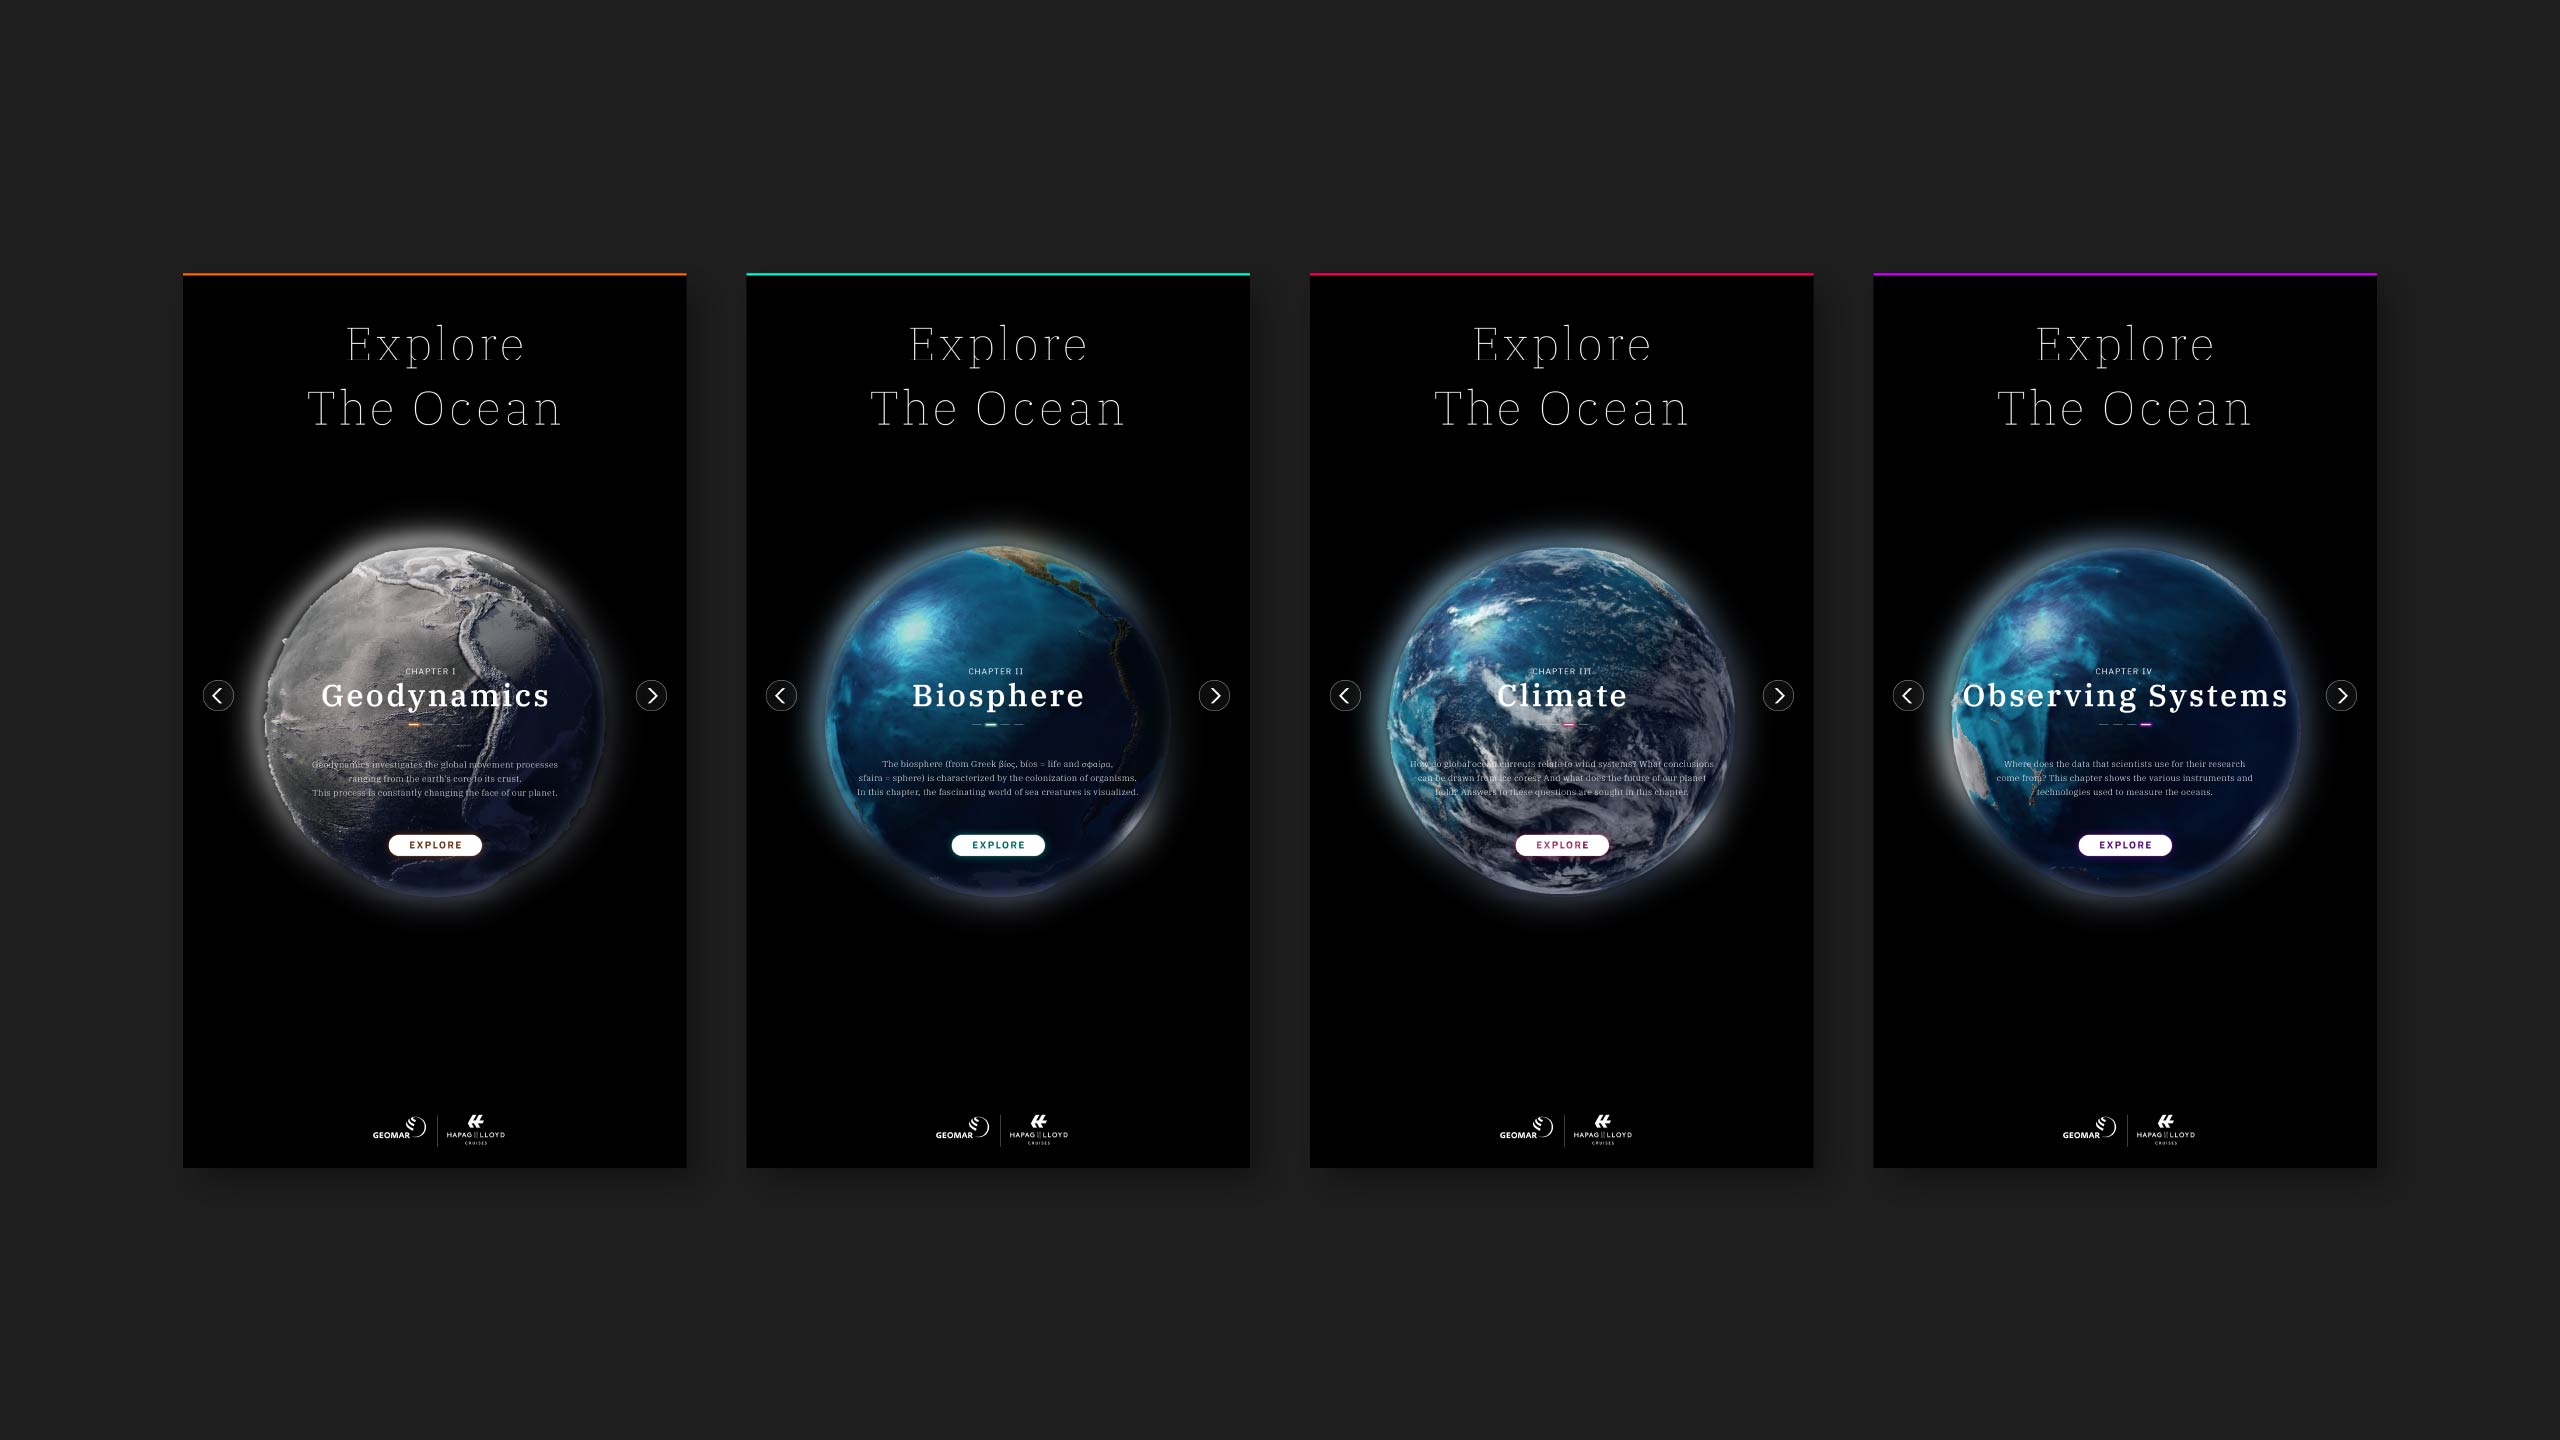
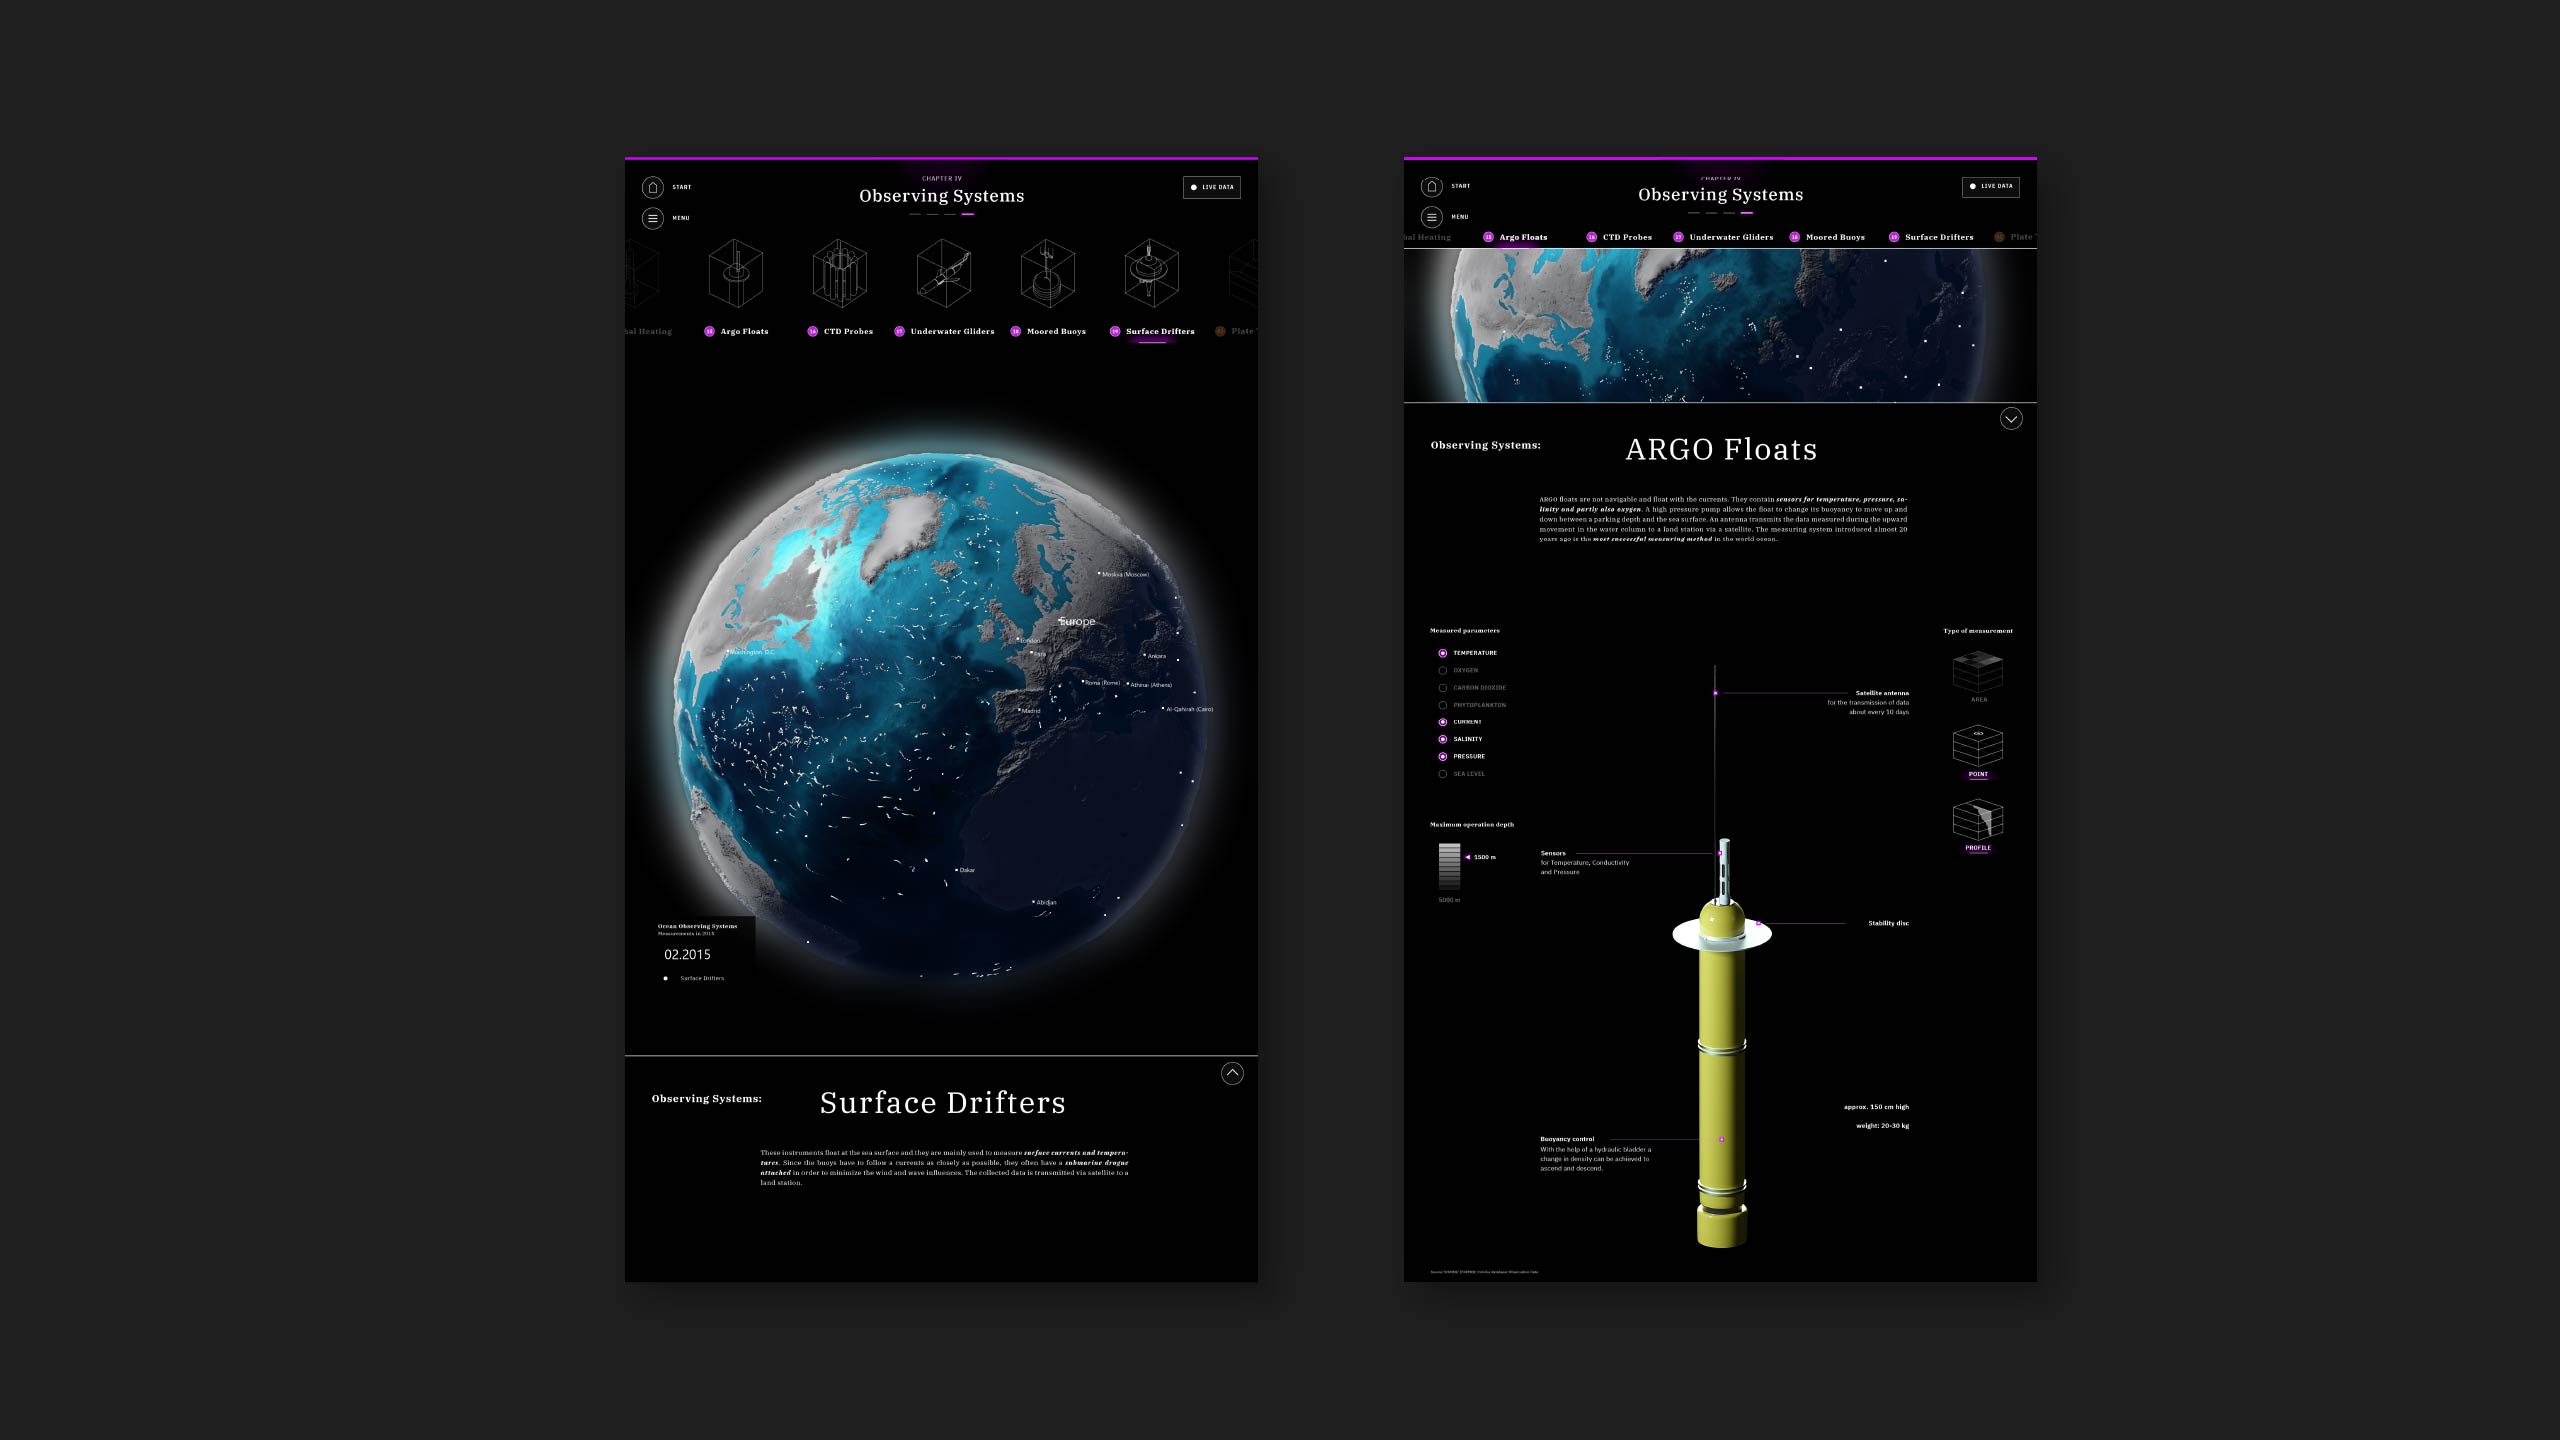
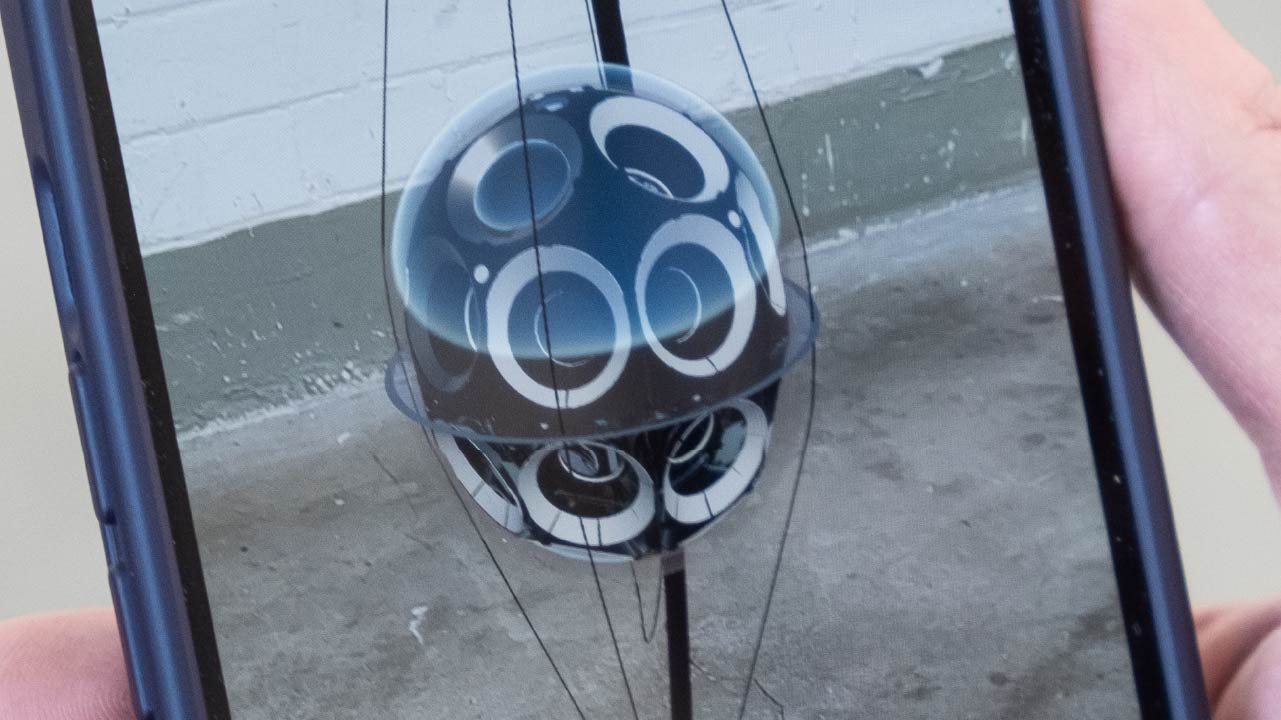
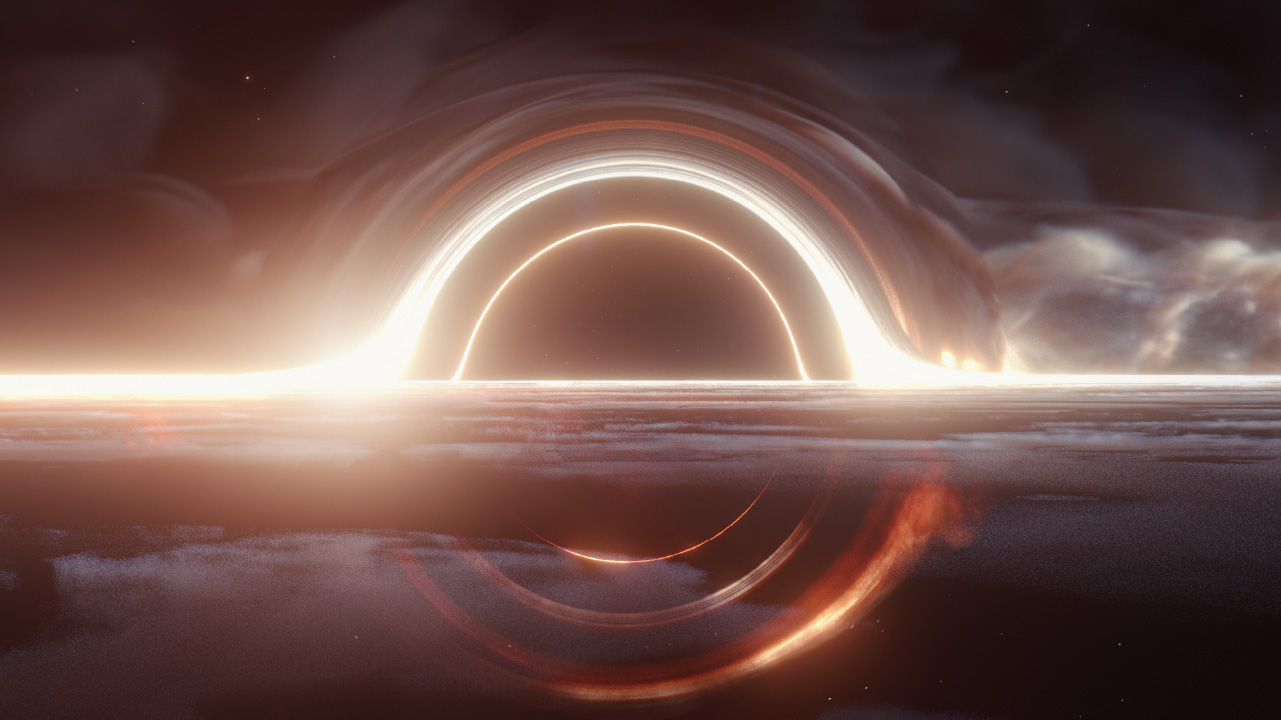
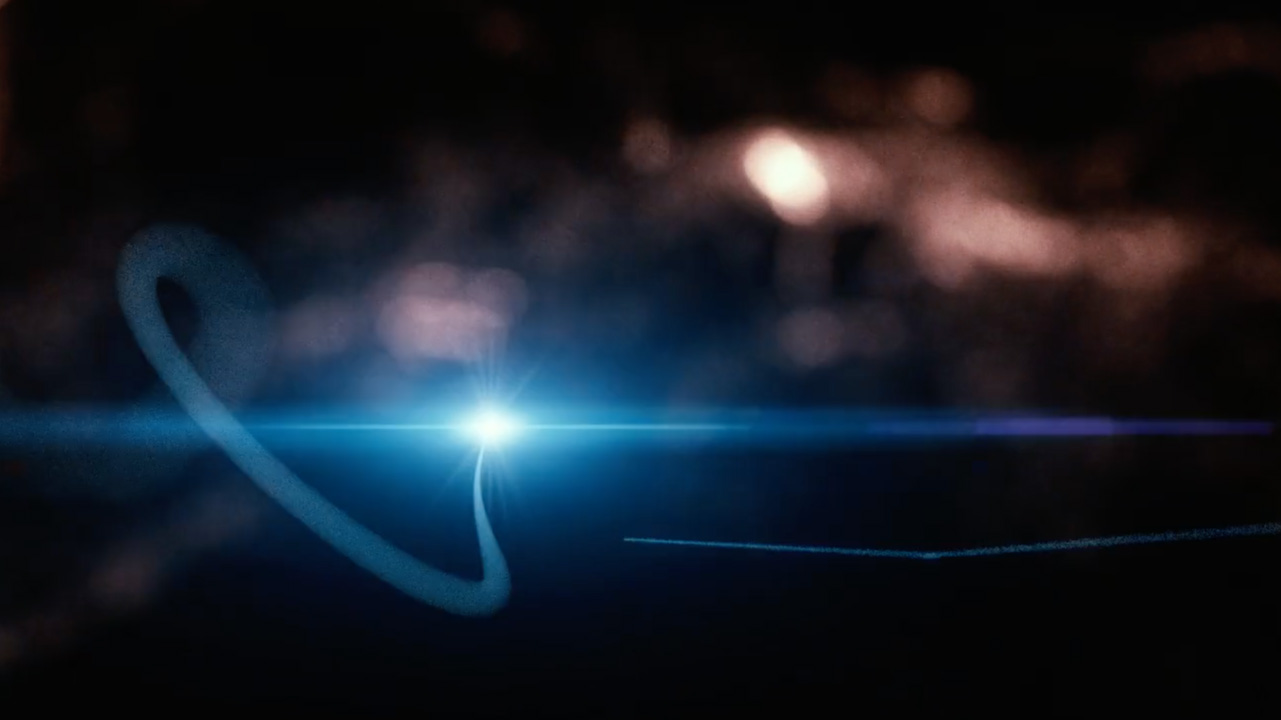
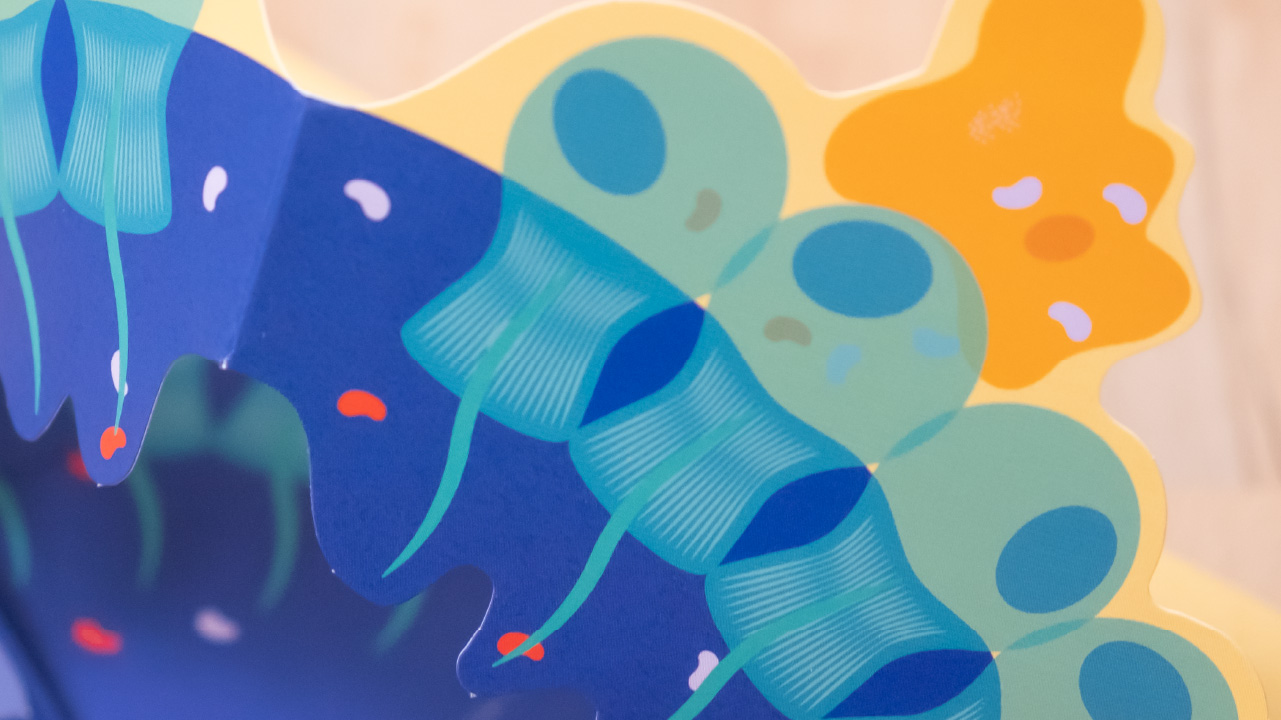
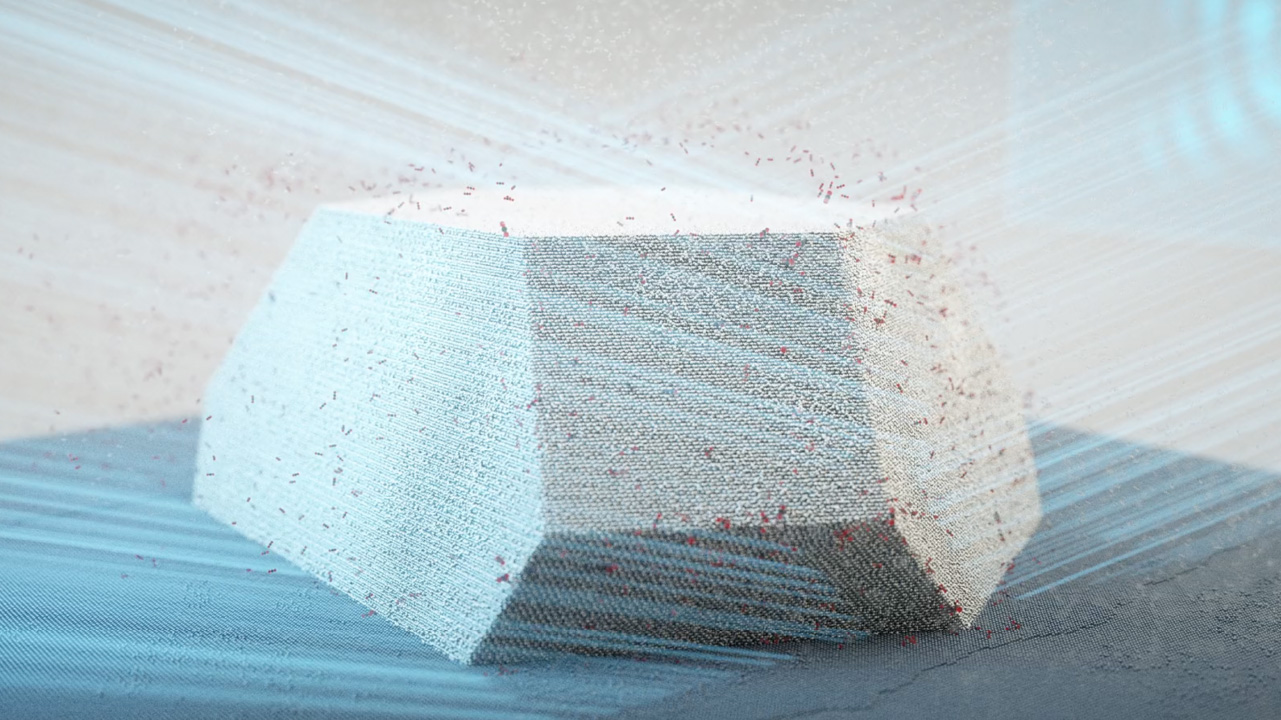
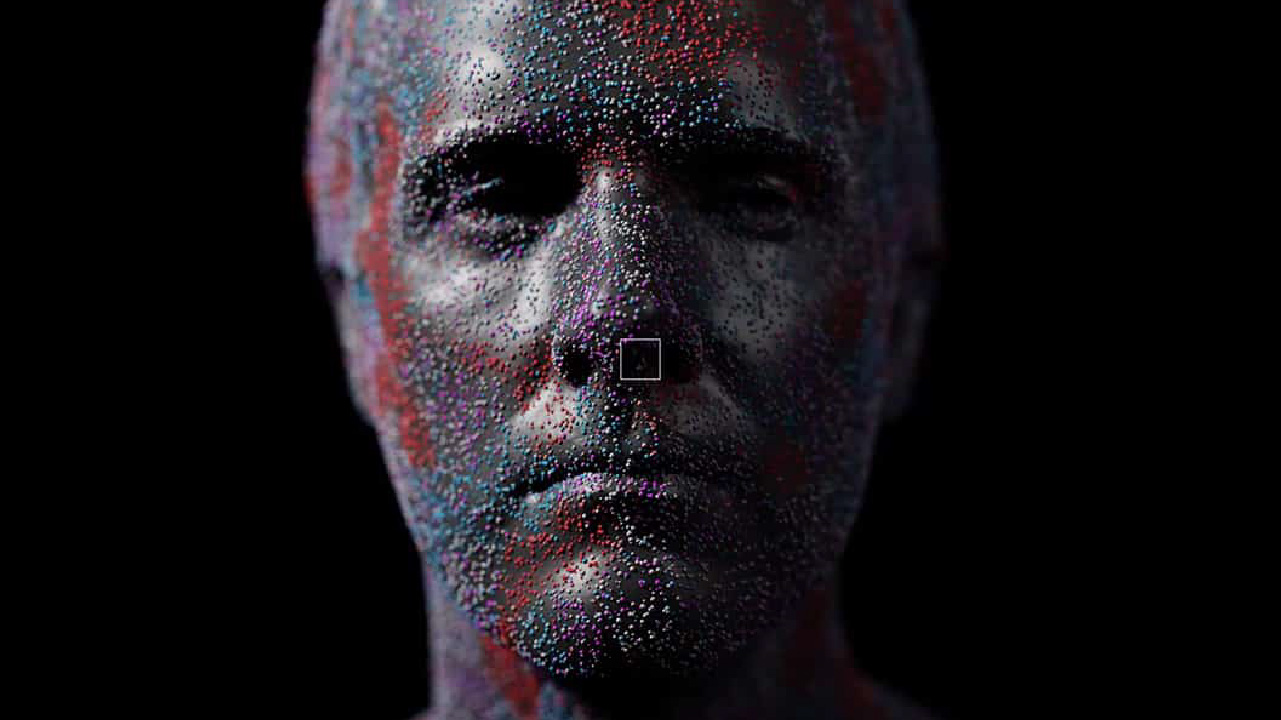
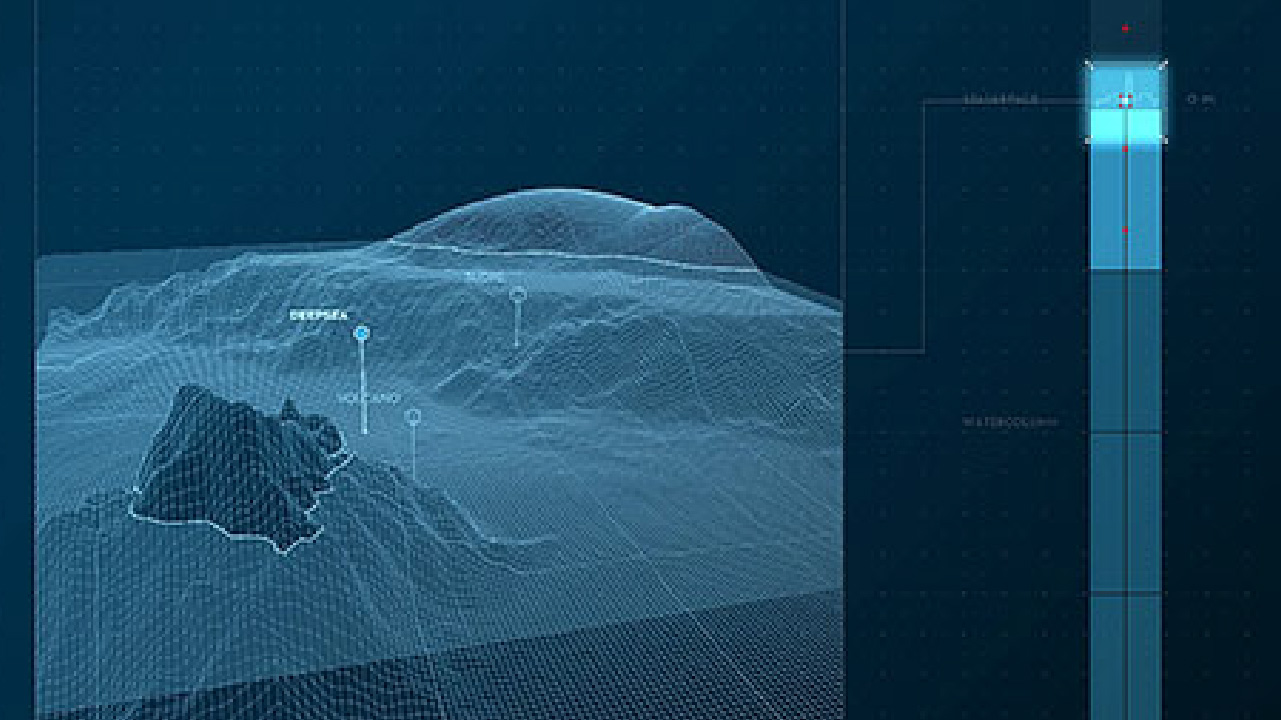
Explore the Ocean
CLIENT
Geomar Helmholtz Centre for Ocean Research, Hapag-Lloyd Cruises
RESEARCH FIELD
TYPE
Interactive Poster
YEAR
2019
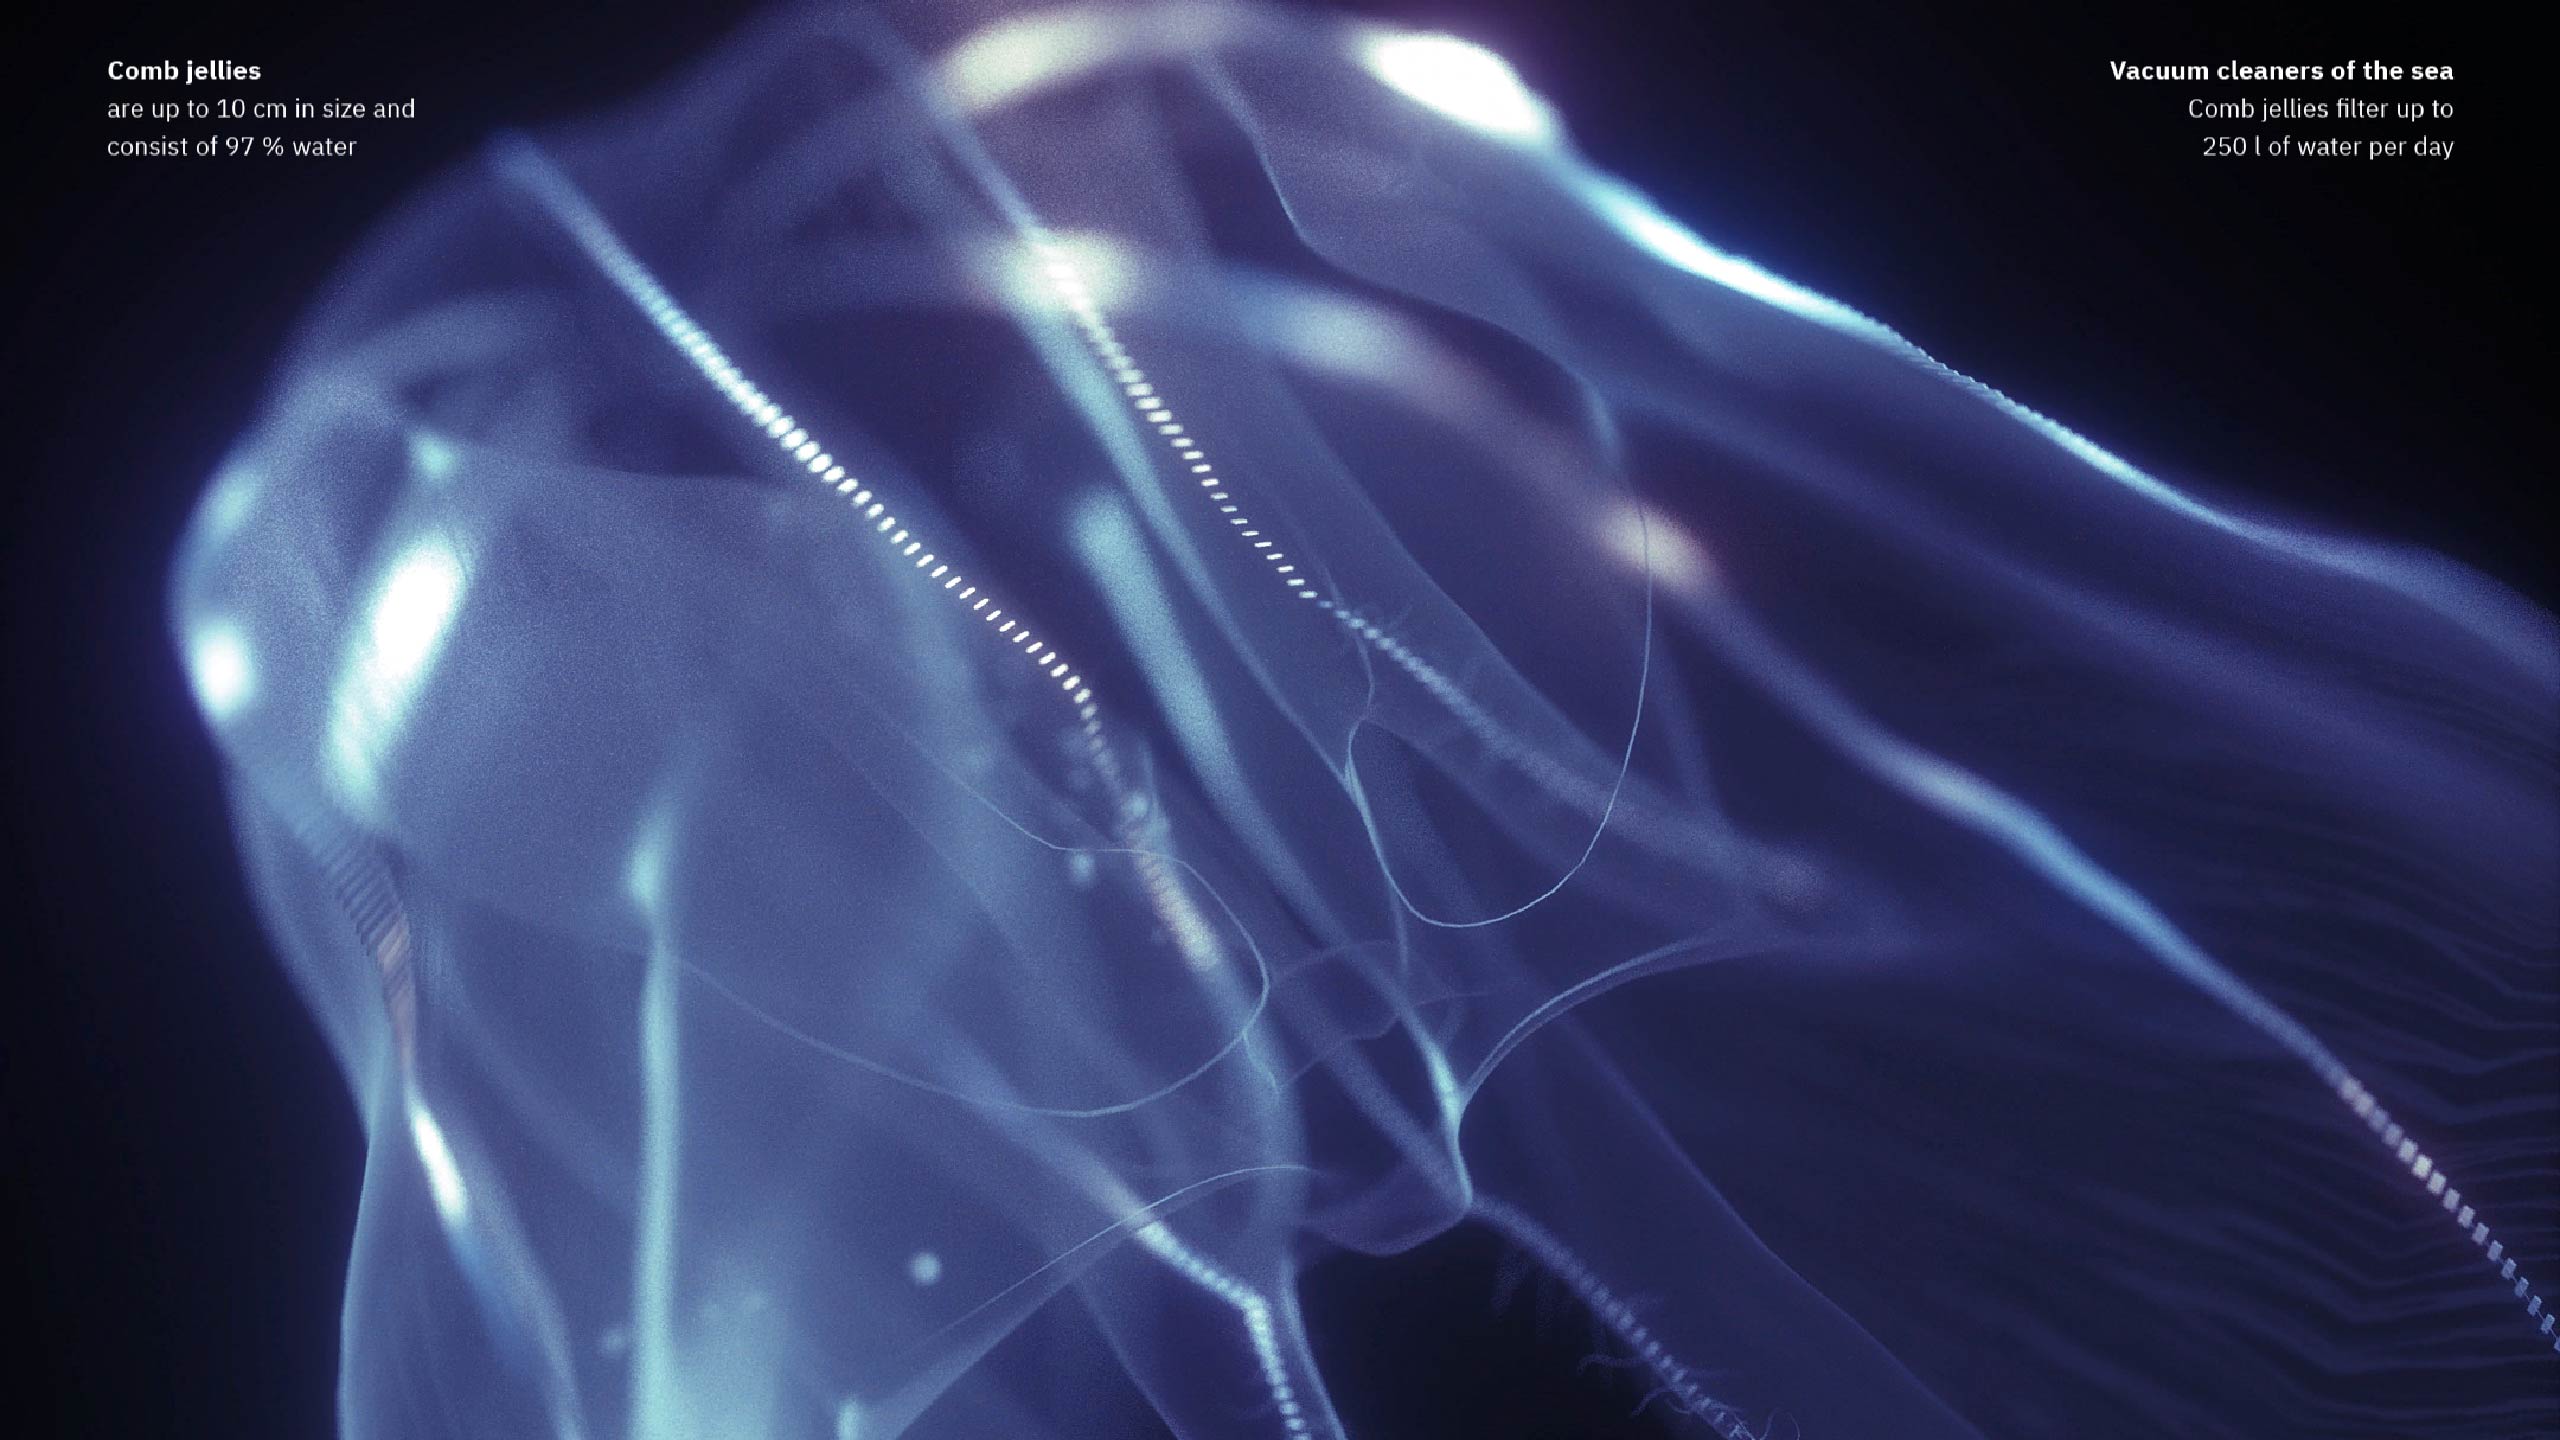
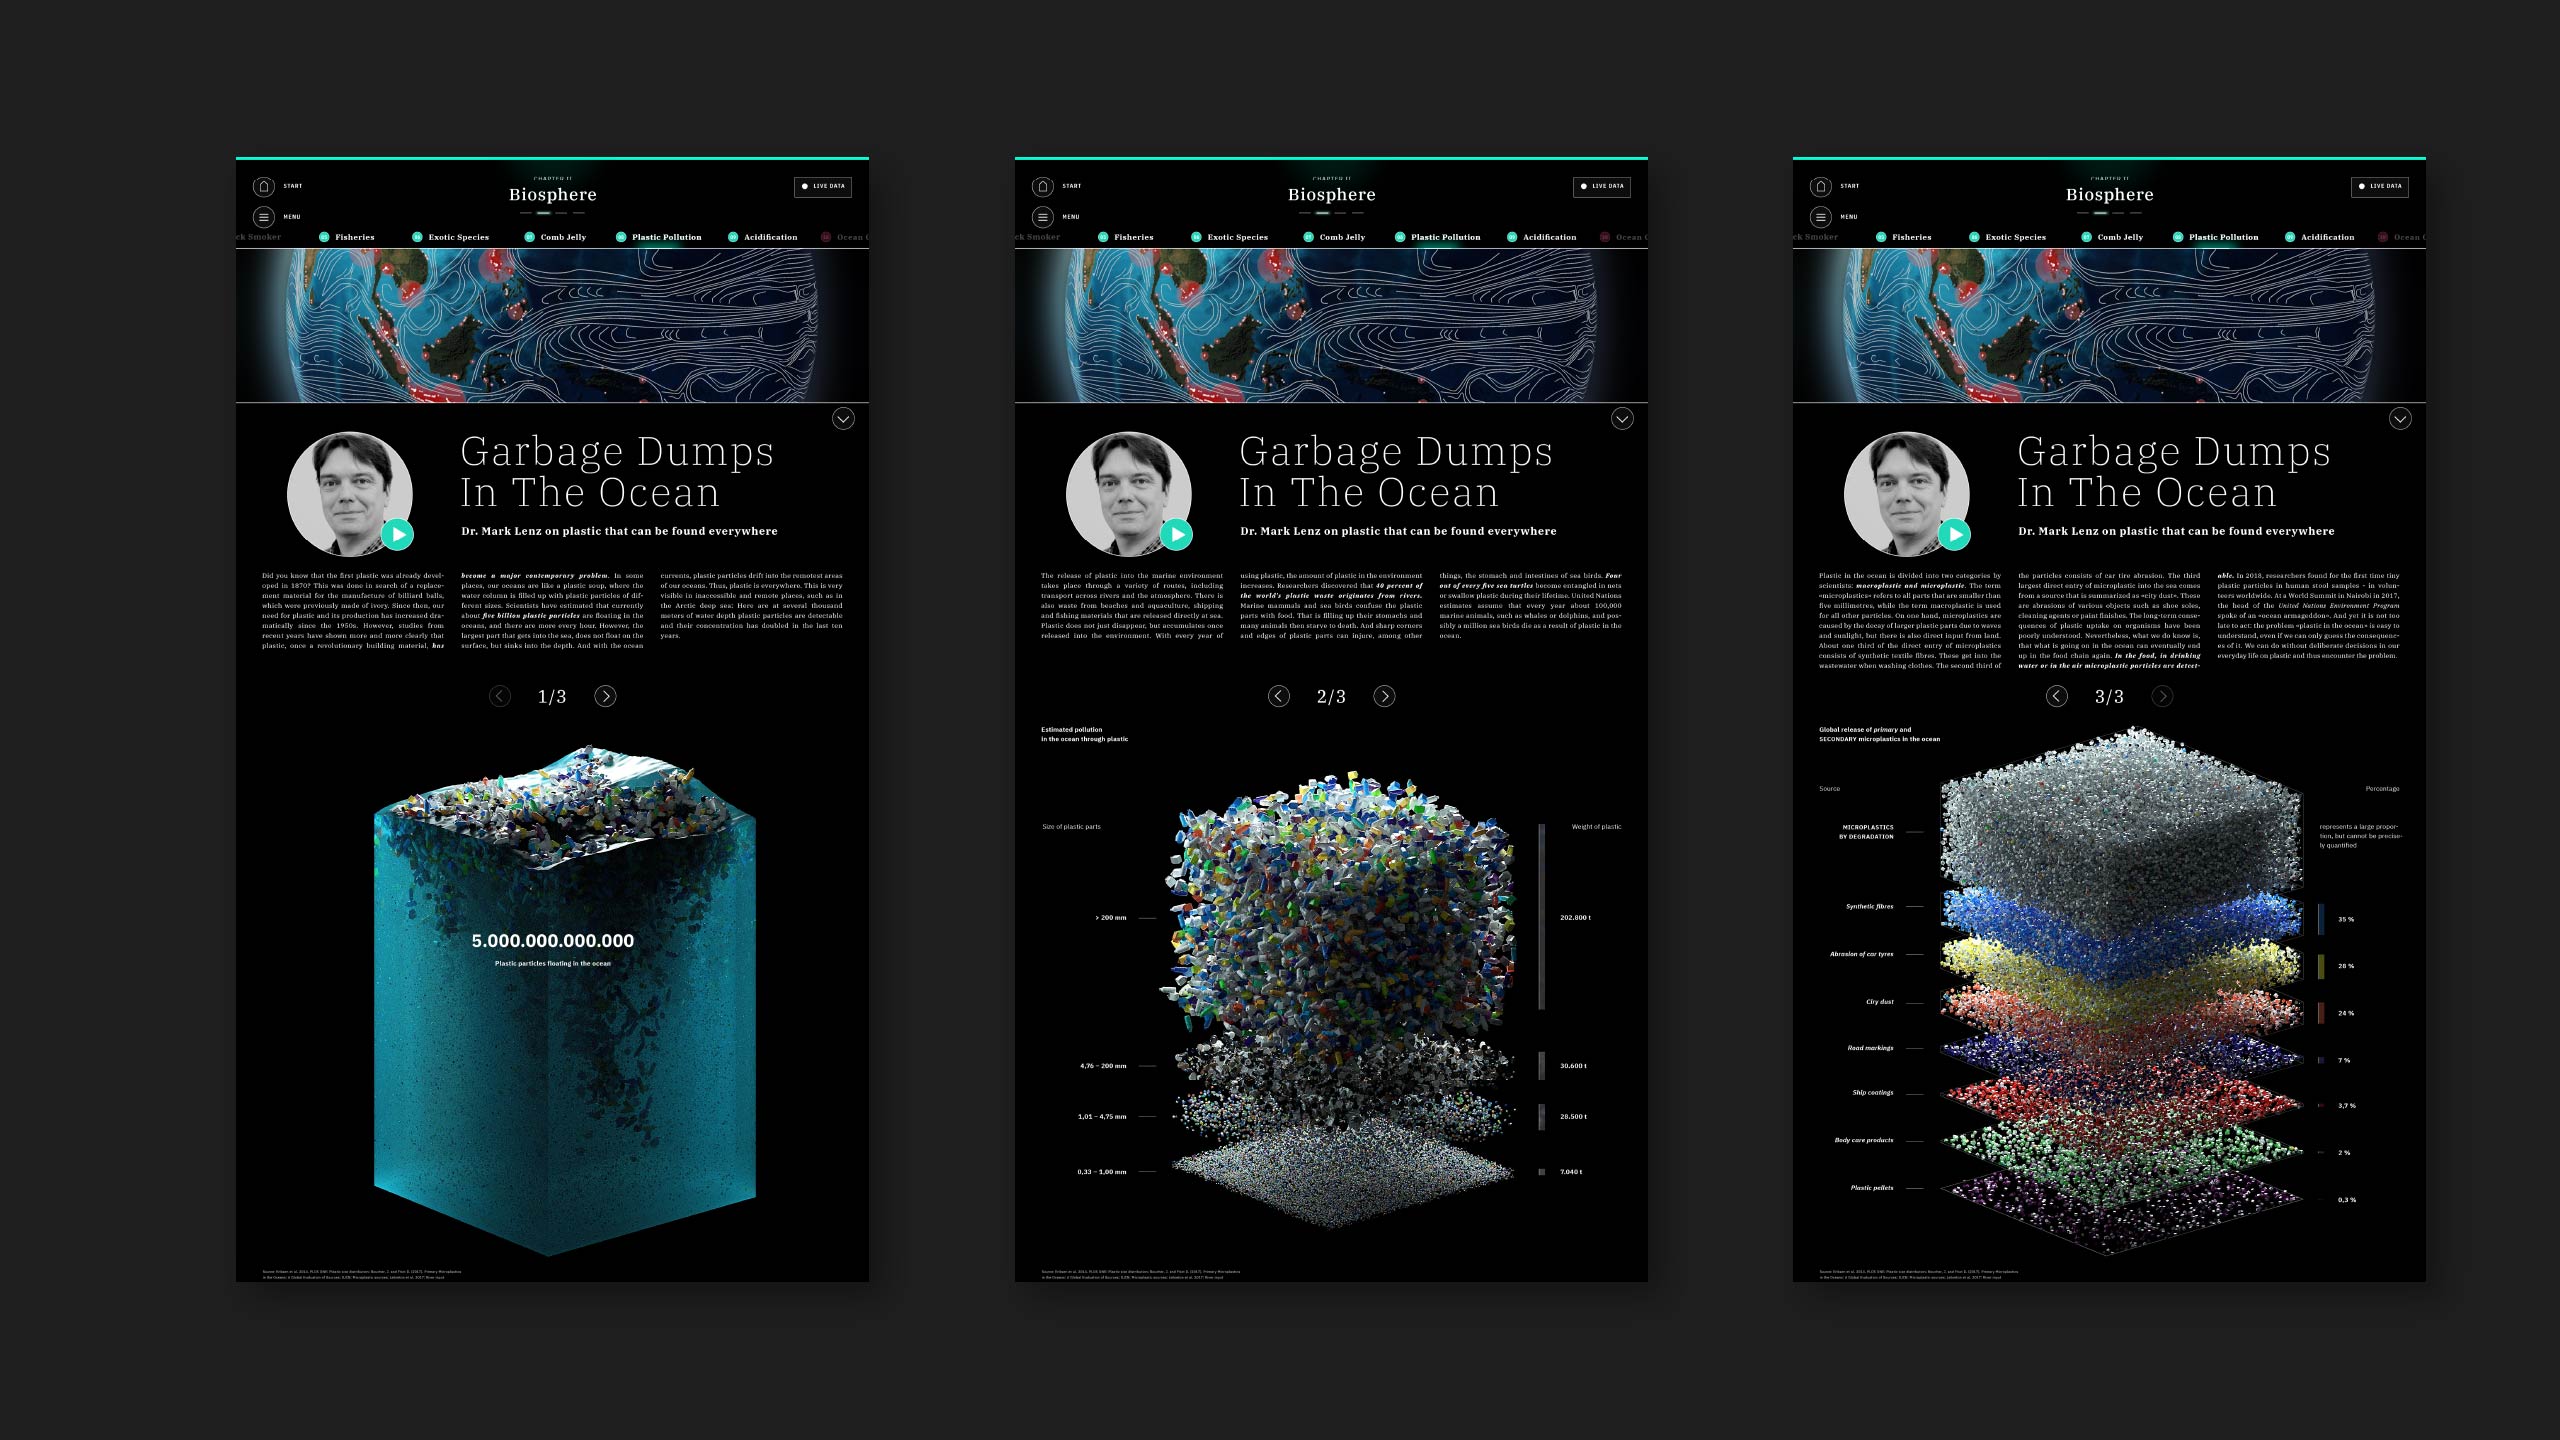
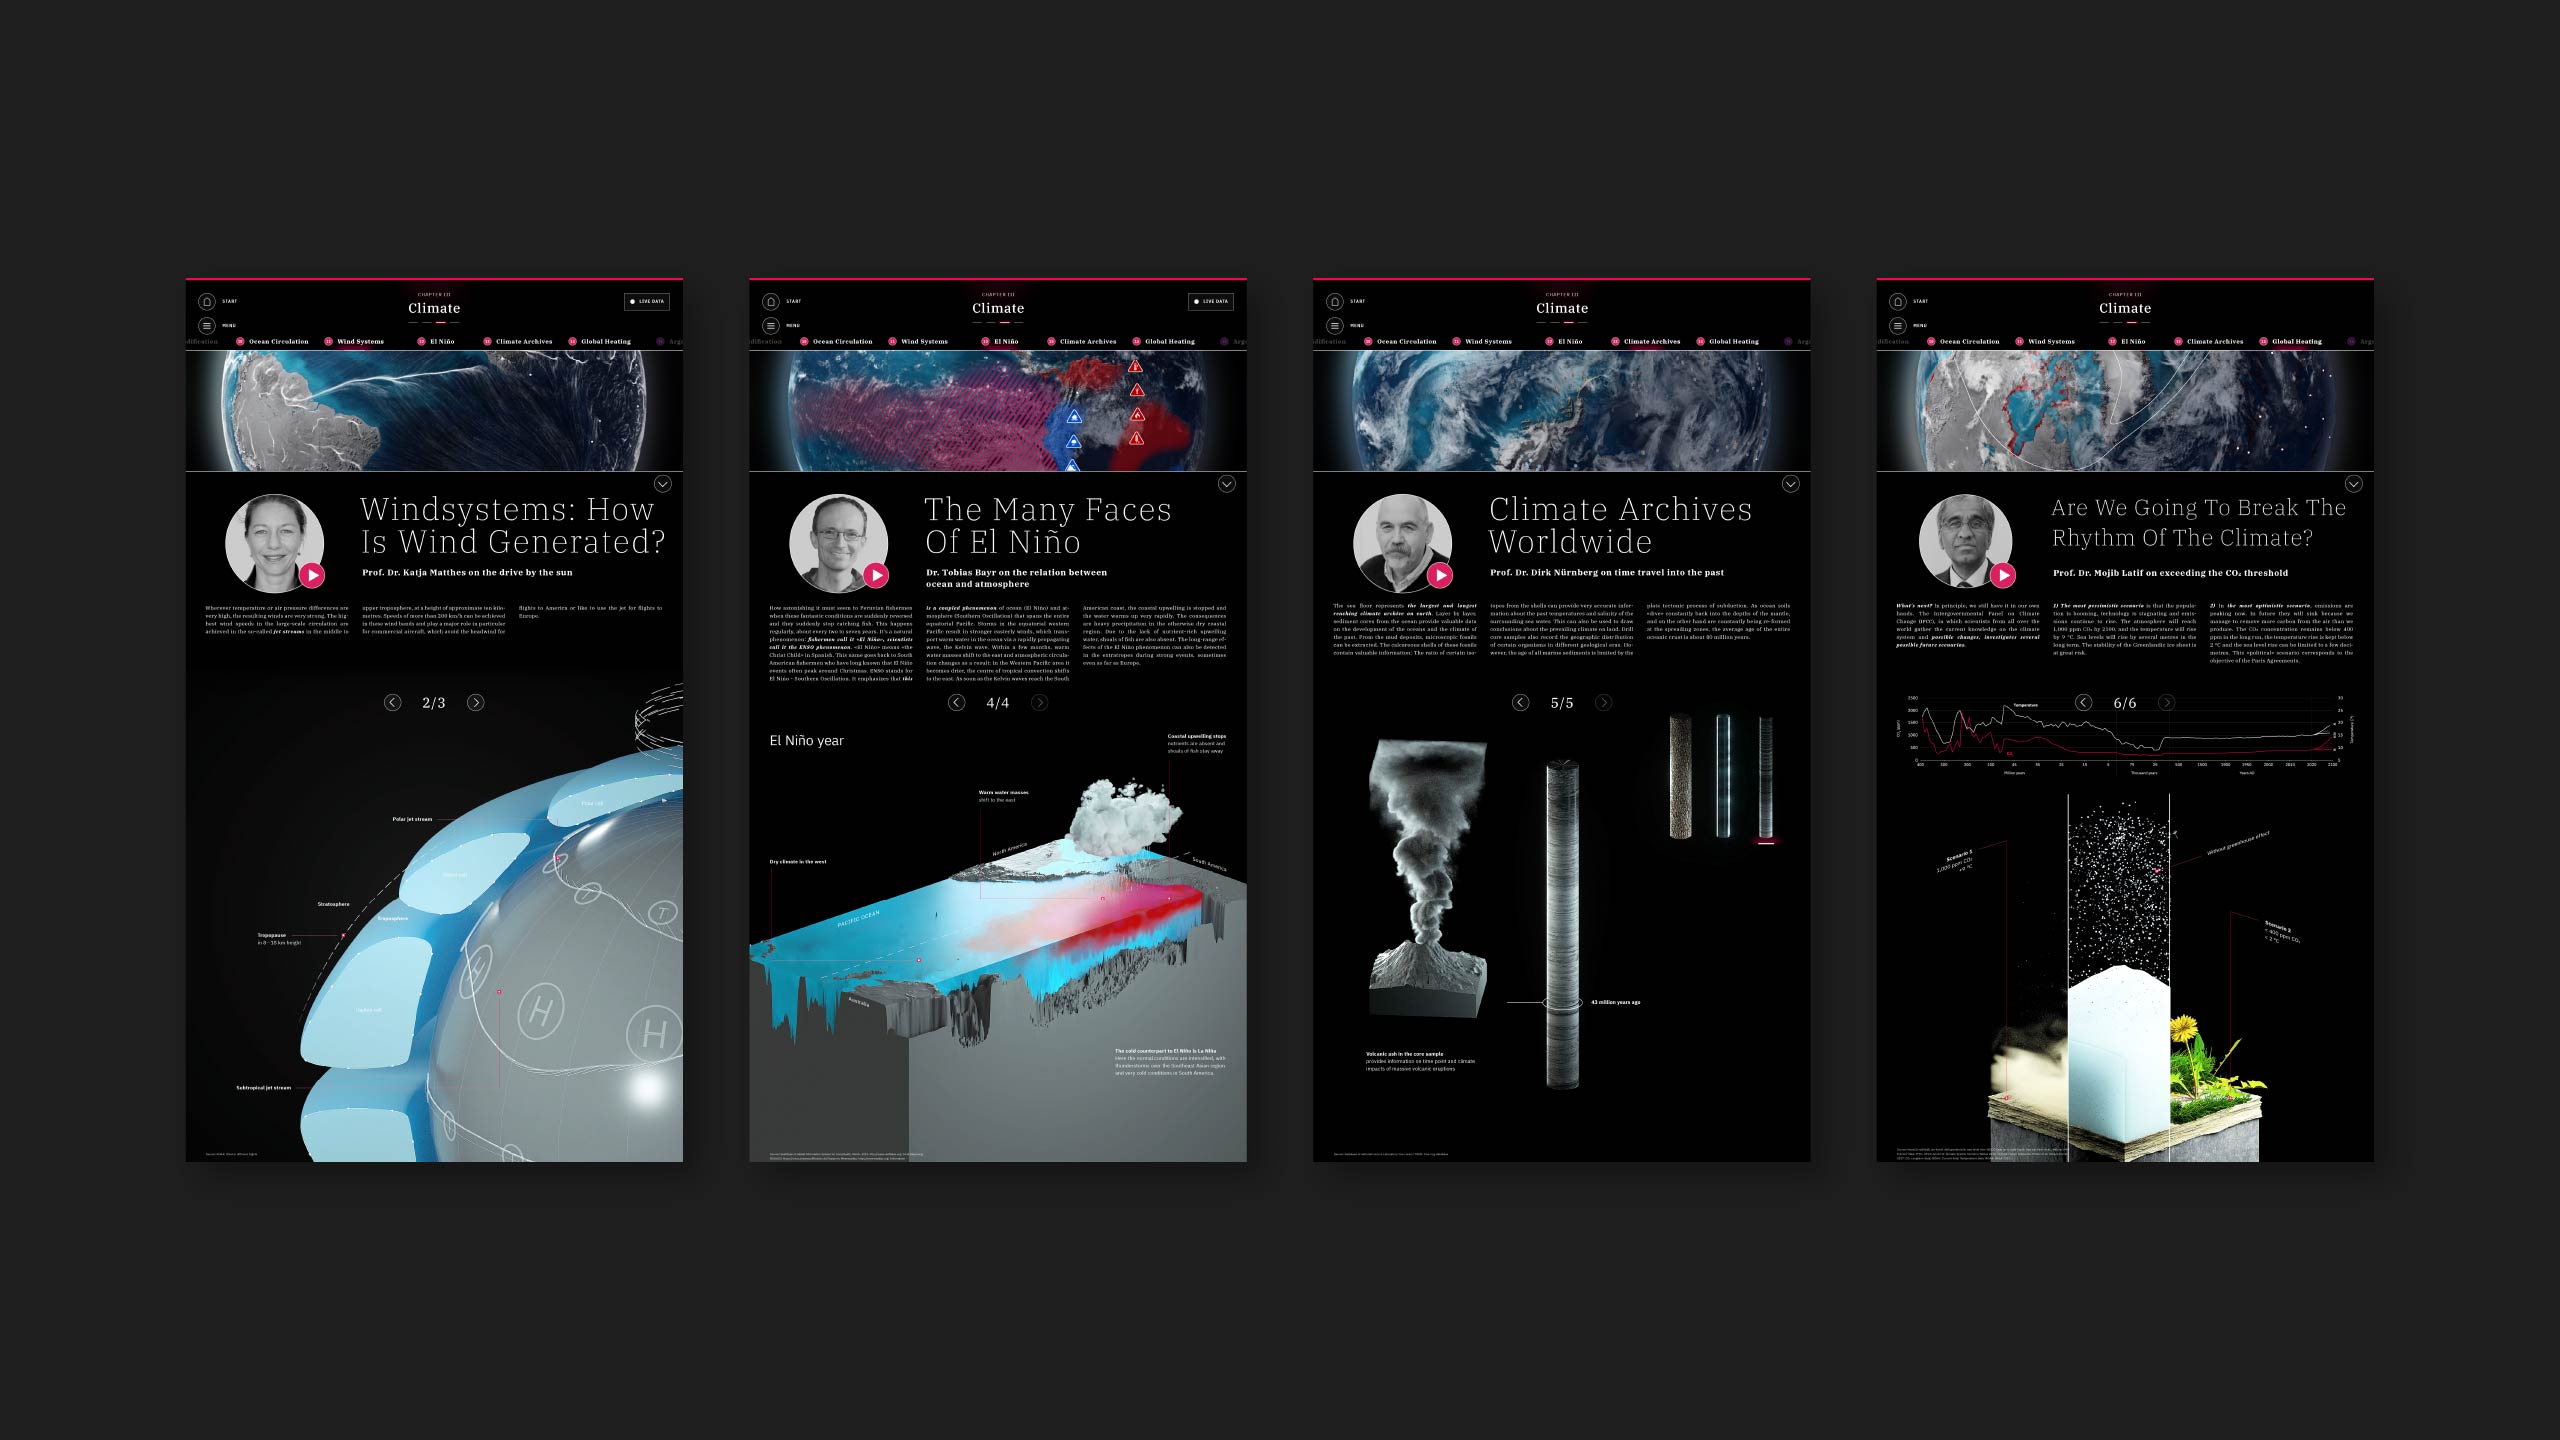
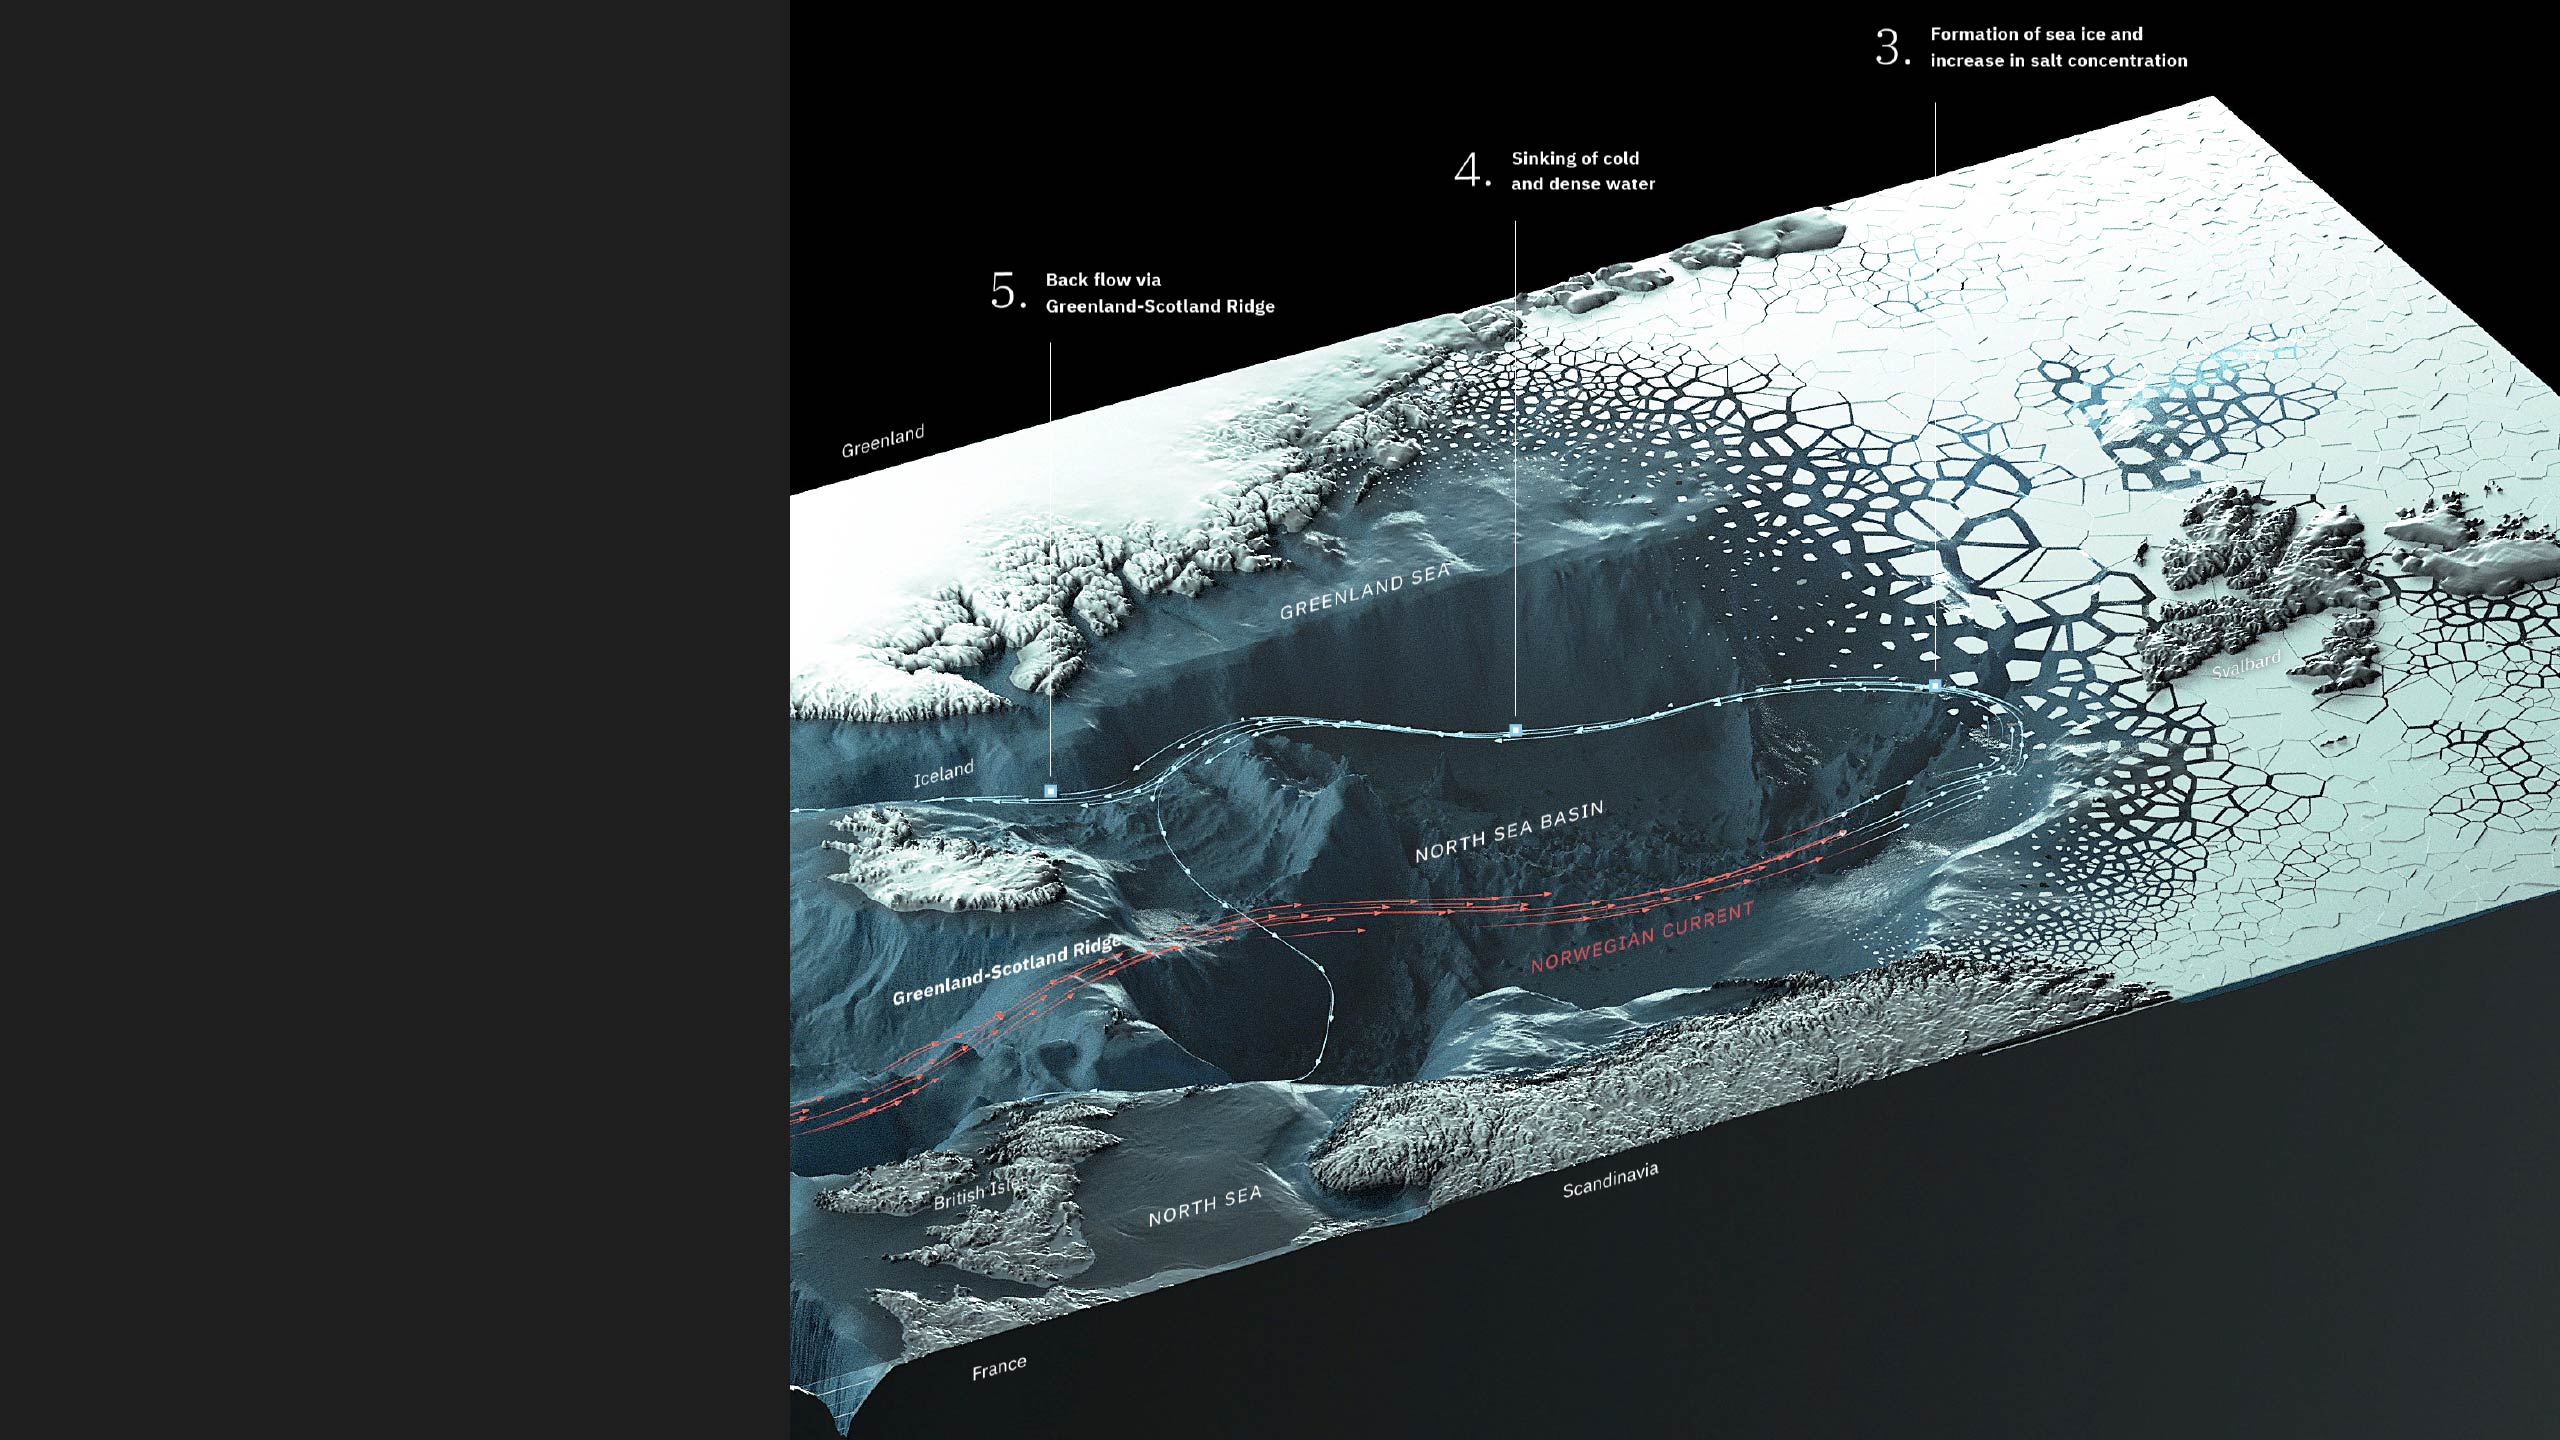
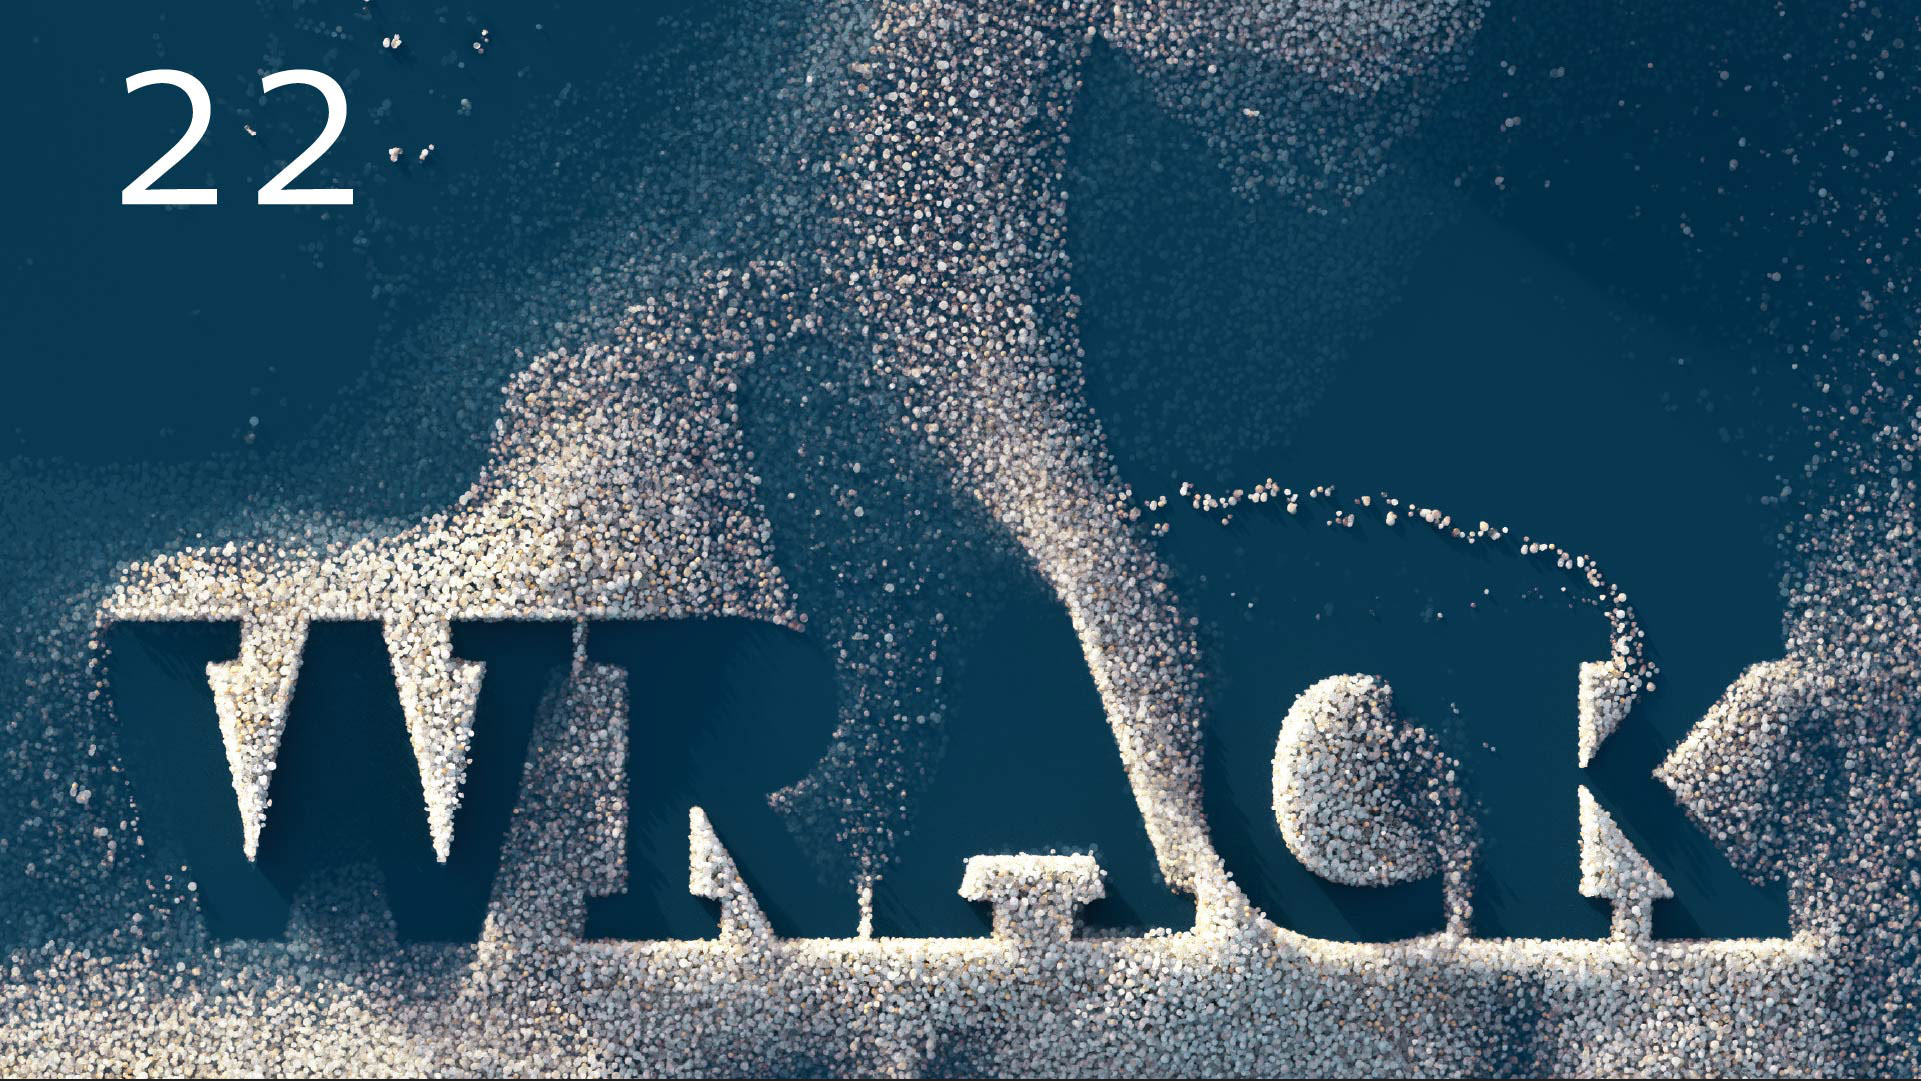
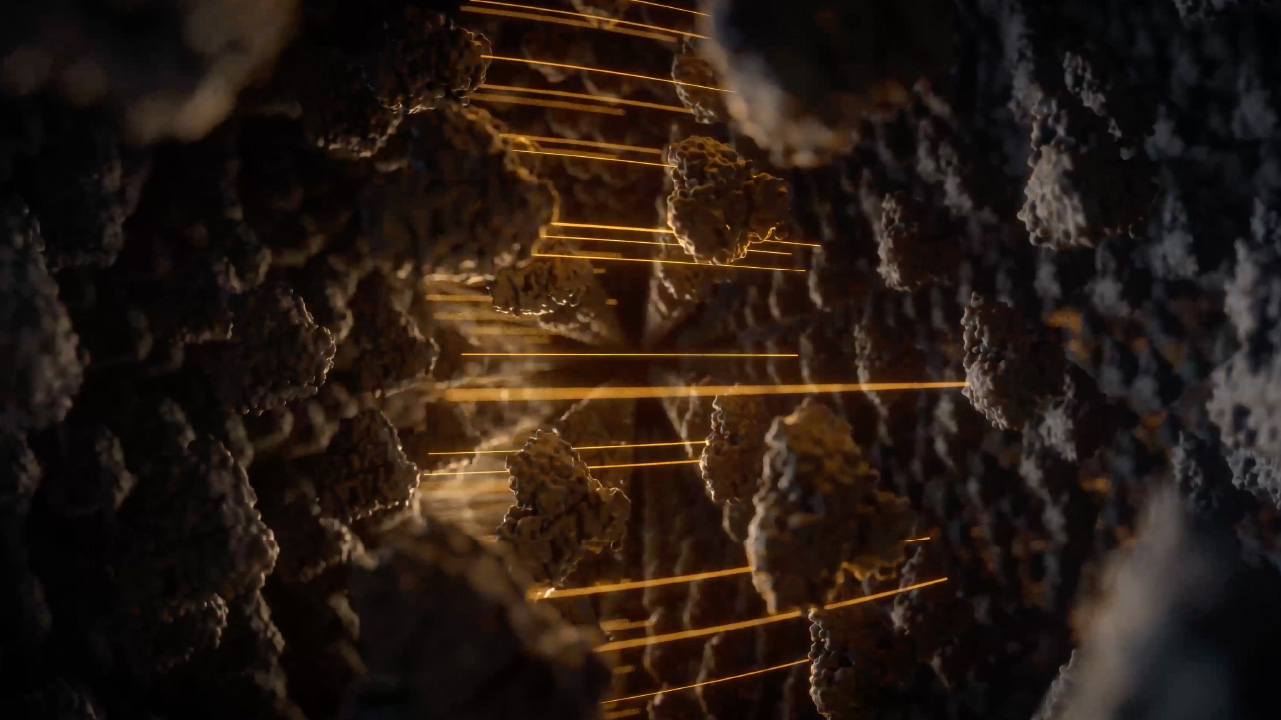
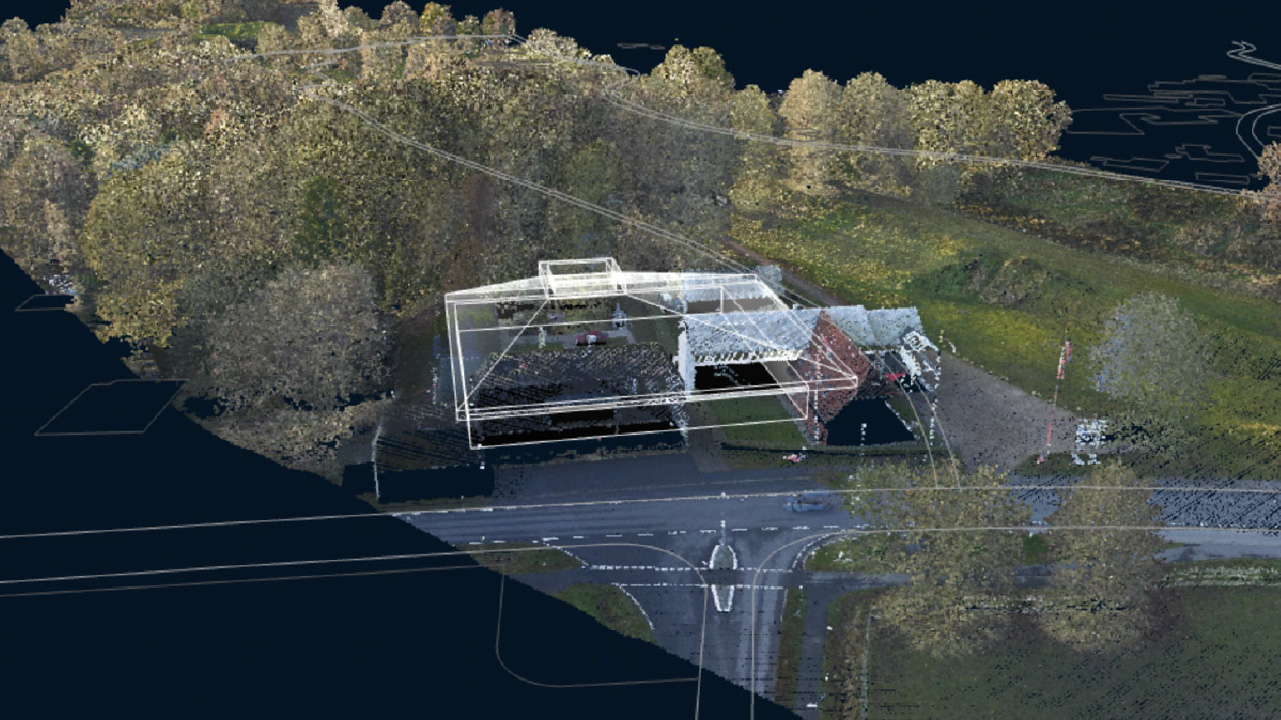
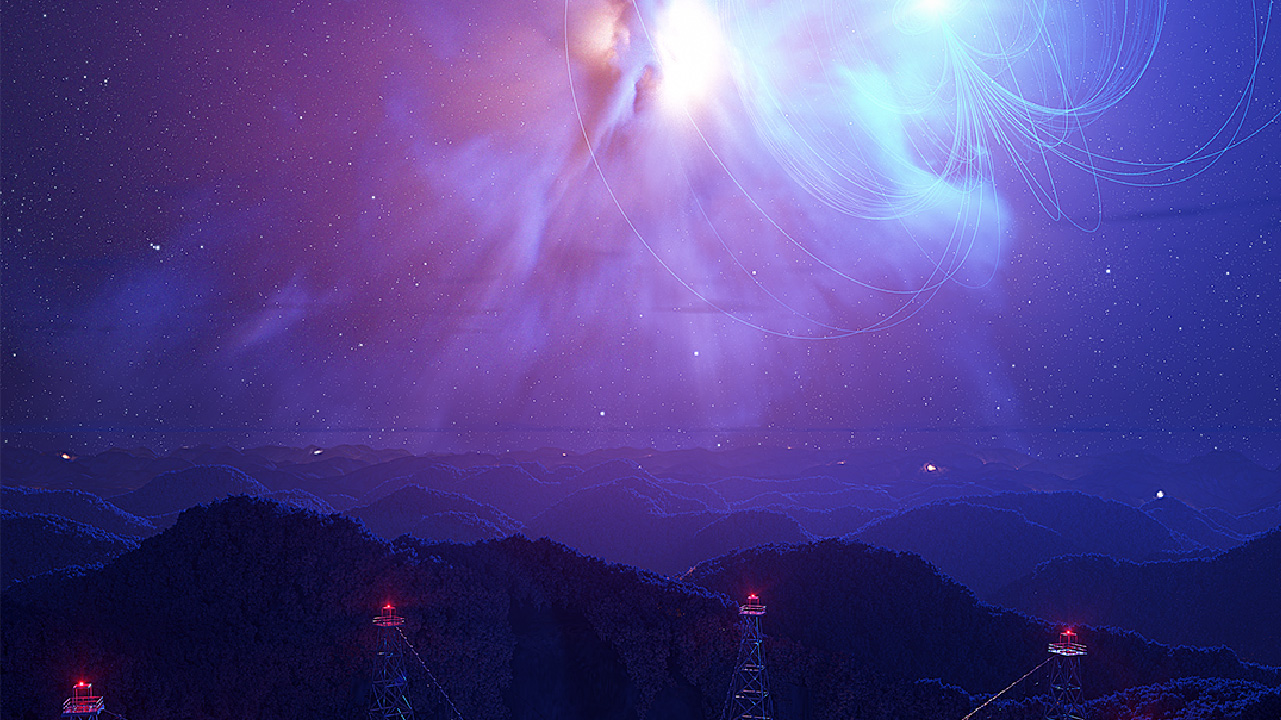
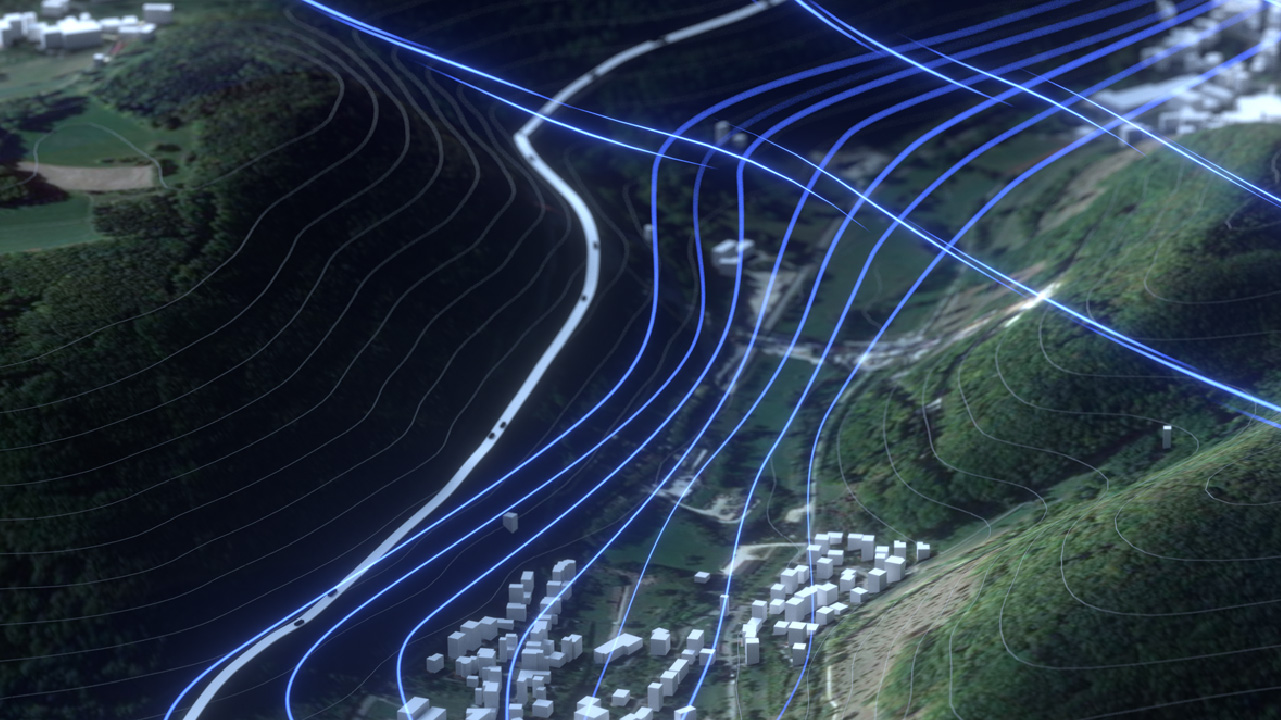
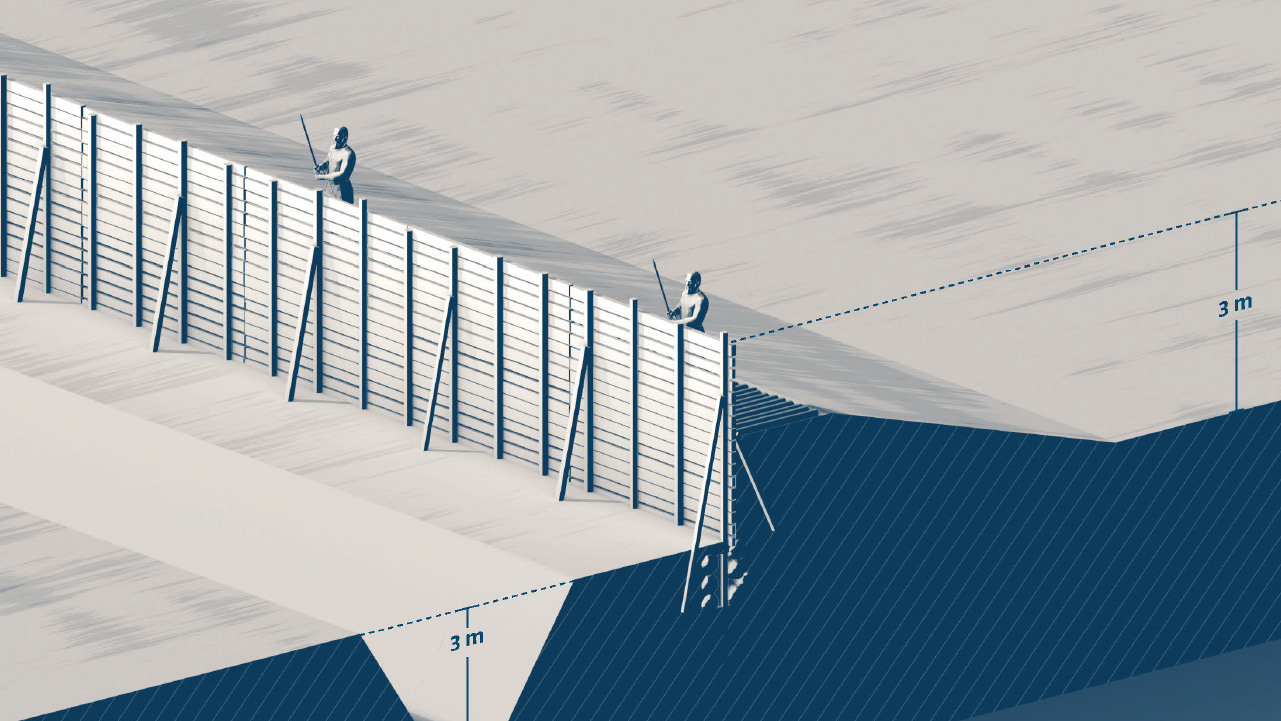
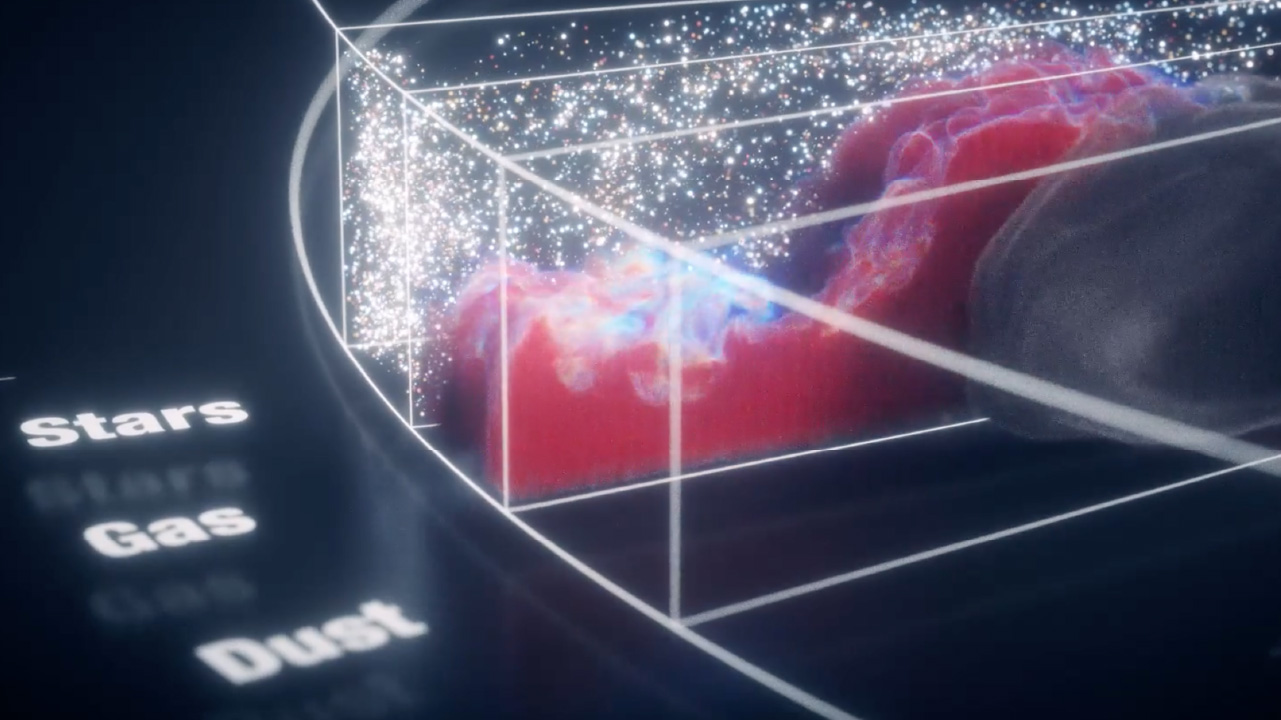
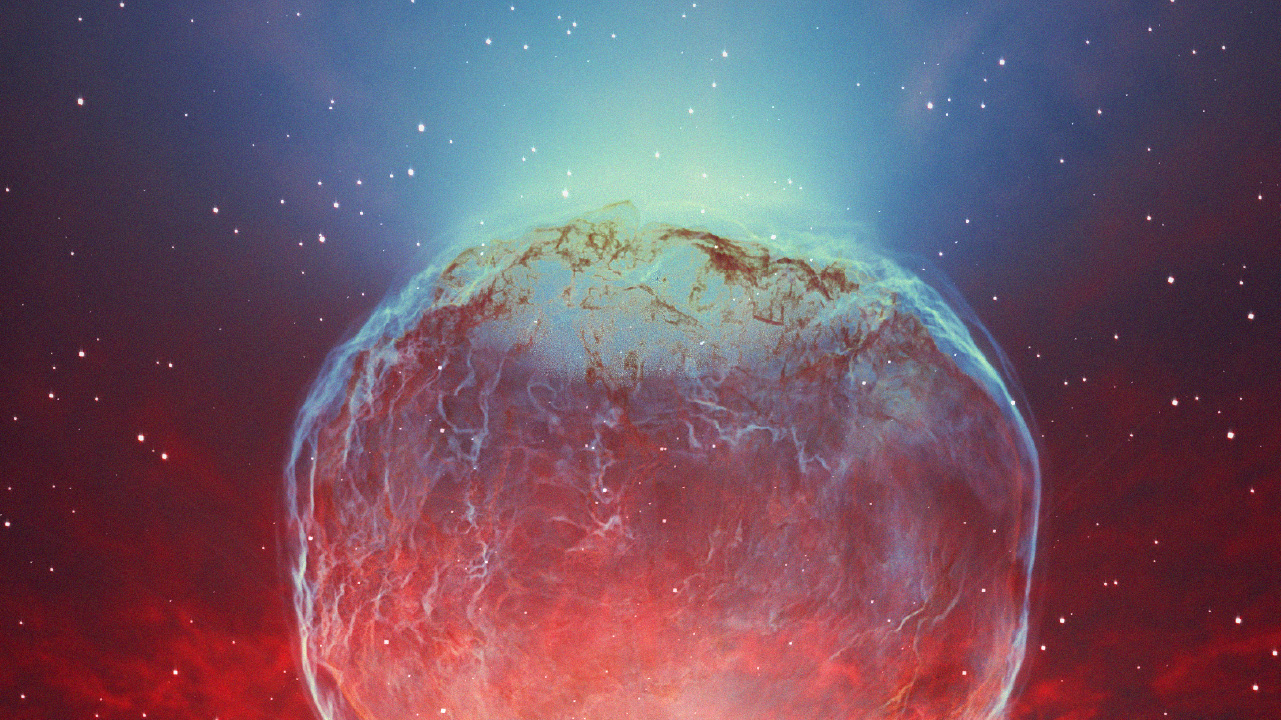
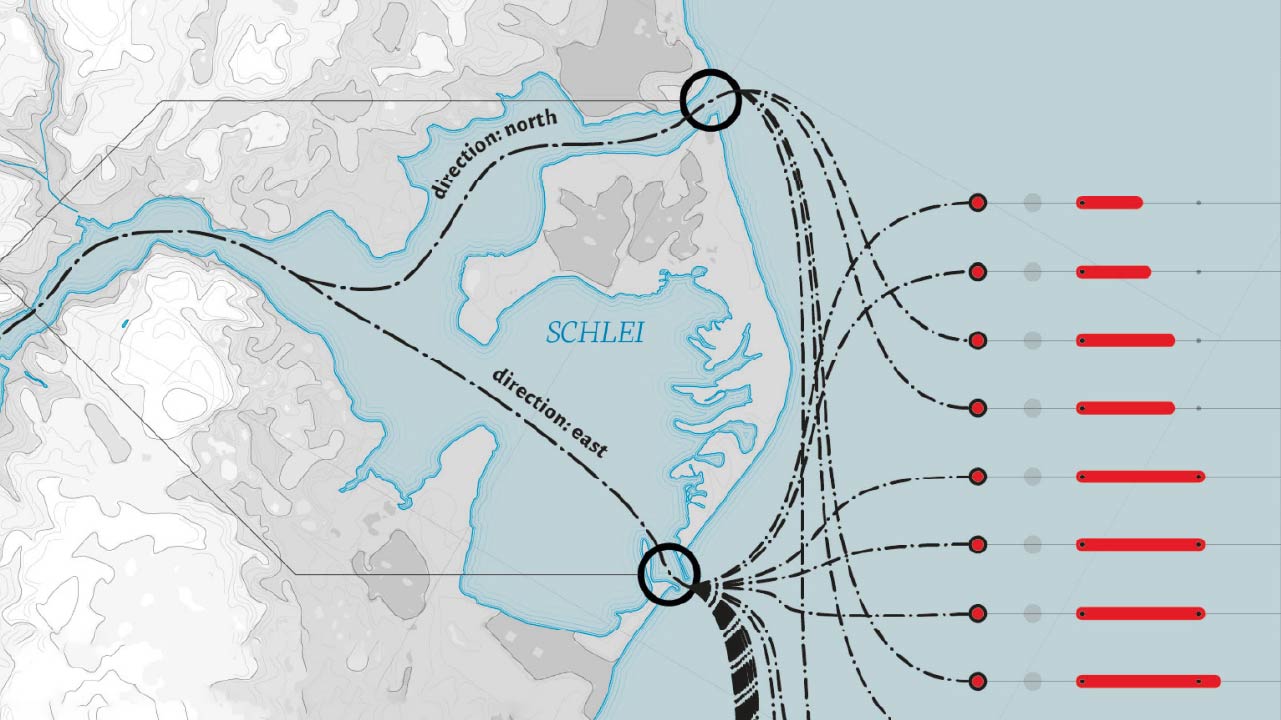
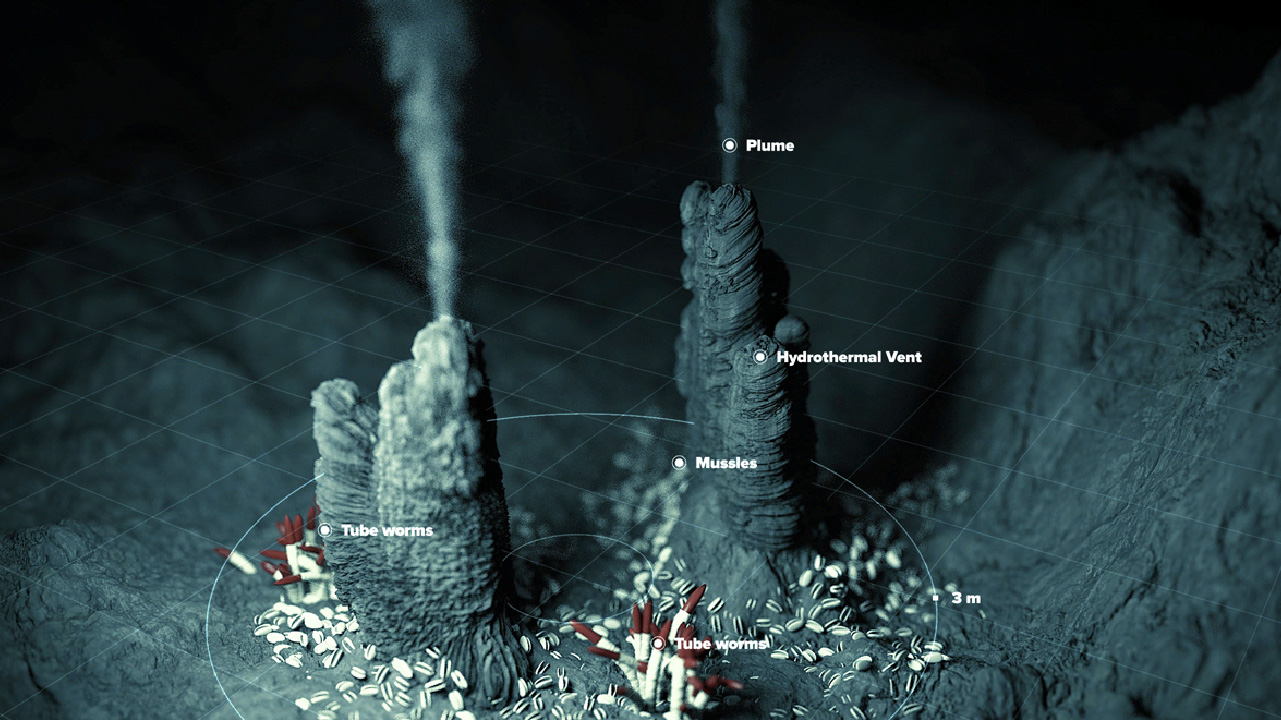
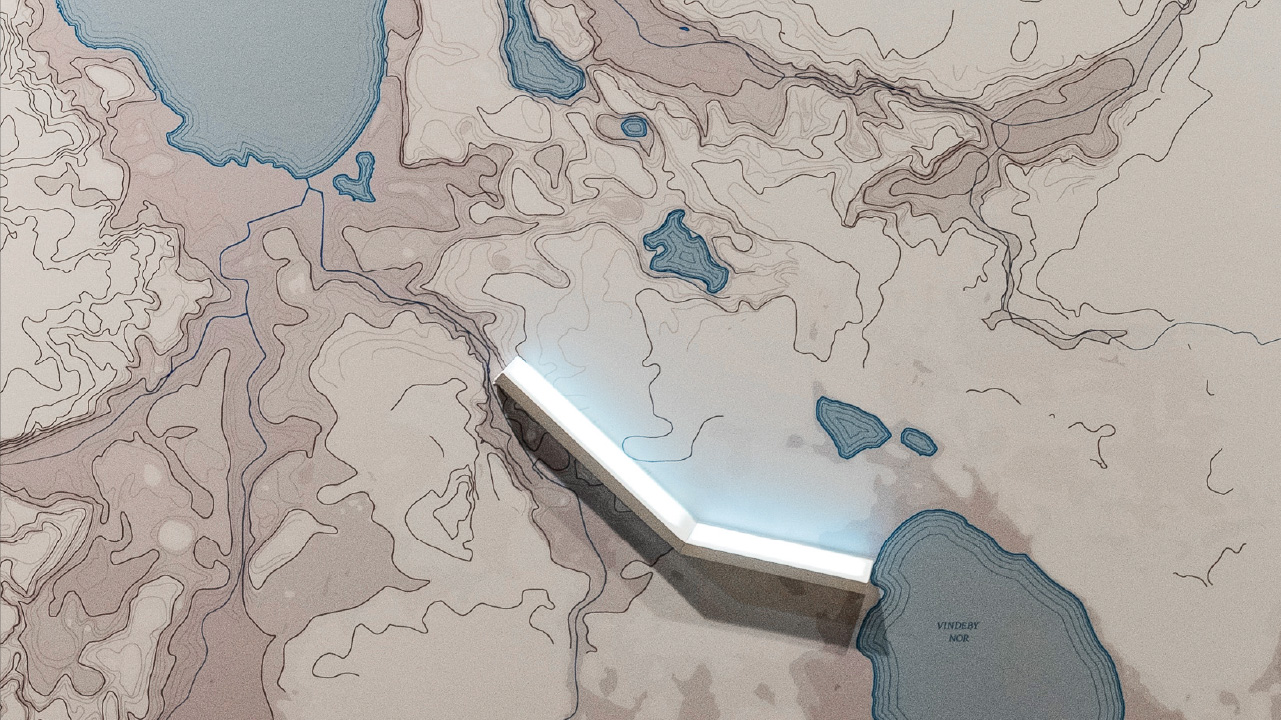
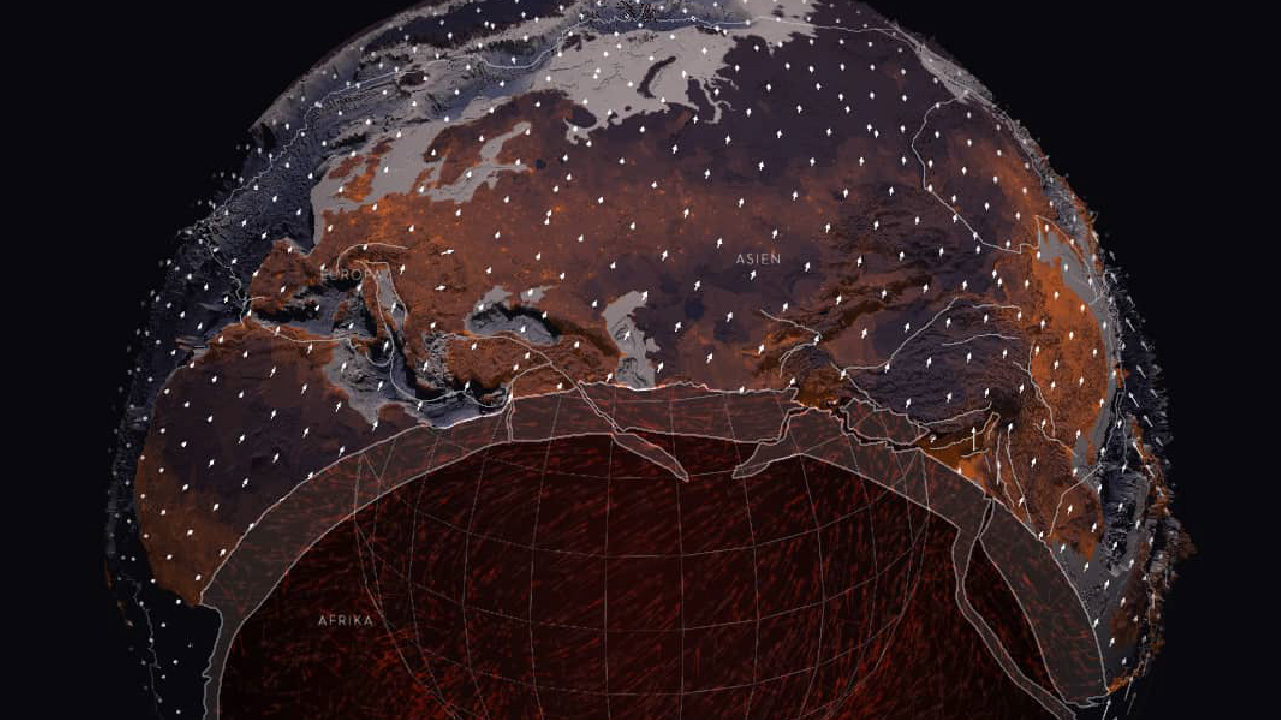
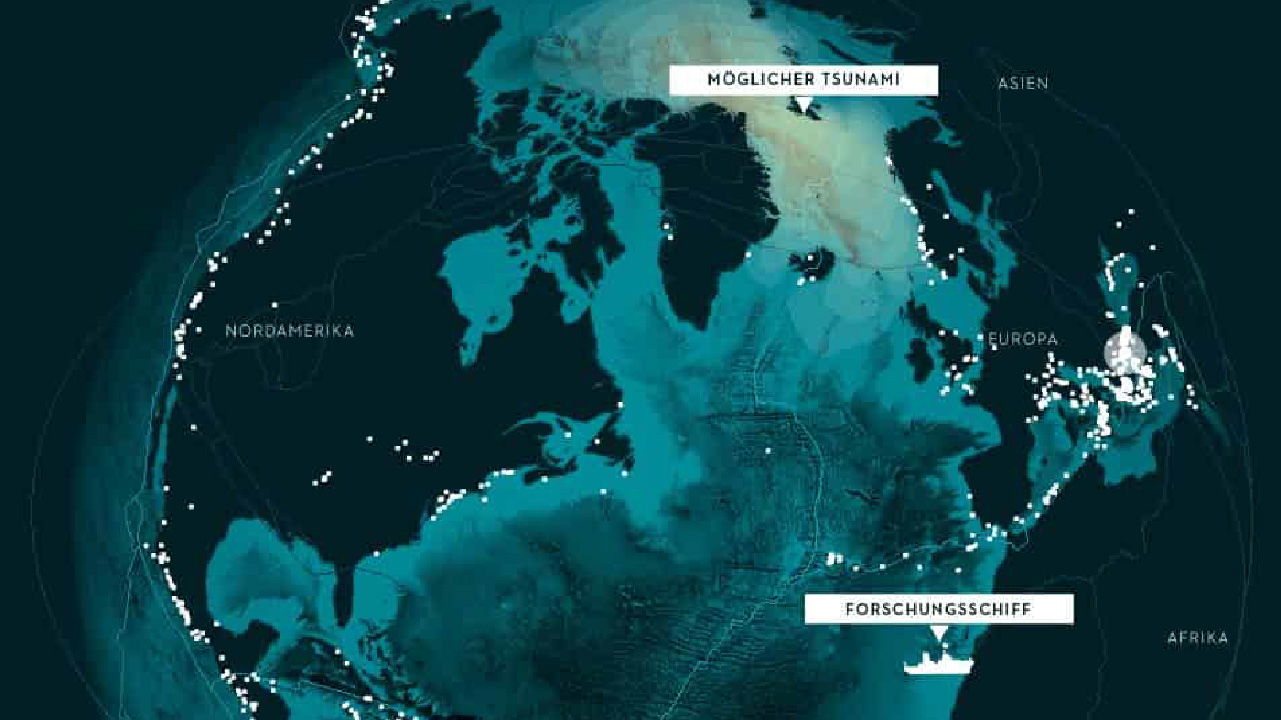
Detailed 3D animations and extensive data visualizations explain global processes in the oceans and make climate change comprehensible for passengers. Spoken audio comments simplify the self-study of the poster, which is divided into 4 chapters and 15 episodes. This rich content makes several visits worthwhile and there is always something new to learn.
Creative Development & Visual Coding: Luna Nane
Scientific Advice: Dr. Tobias Bayr, Prof. Dr. Arne Biastoch, Prof. Dr. Colin Devey, Dr. Jan Dierking, Dr. Matthias Haeckel, Dr. Helena Hauss, Dr. Henk-Jan Hoving, Dr. Cornelia Jaspers, Prof. Dr. Heidrun Kopp, Prof. Dr. Mojib Latif, Dr. Mark Lenz, Prof. Dr. Katja Matthes, Prof. Dr. Dirk Nürnberg, Dr. Olivia Roth, Dr. Sven Petersen, Dr. Marlene Wall
Editors: Dr. Gerd Hoffmann-Wiek, Dr. Andreas Villwock
More projects
TransformationsProject type
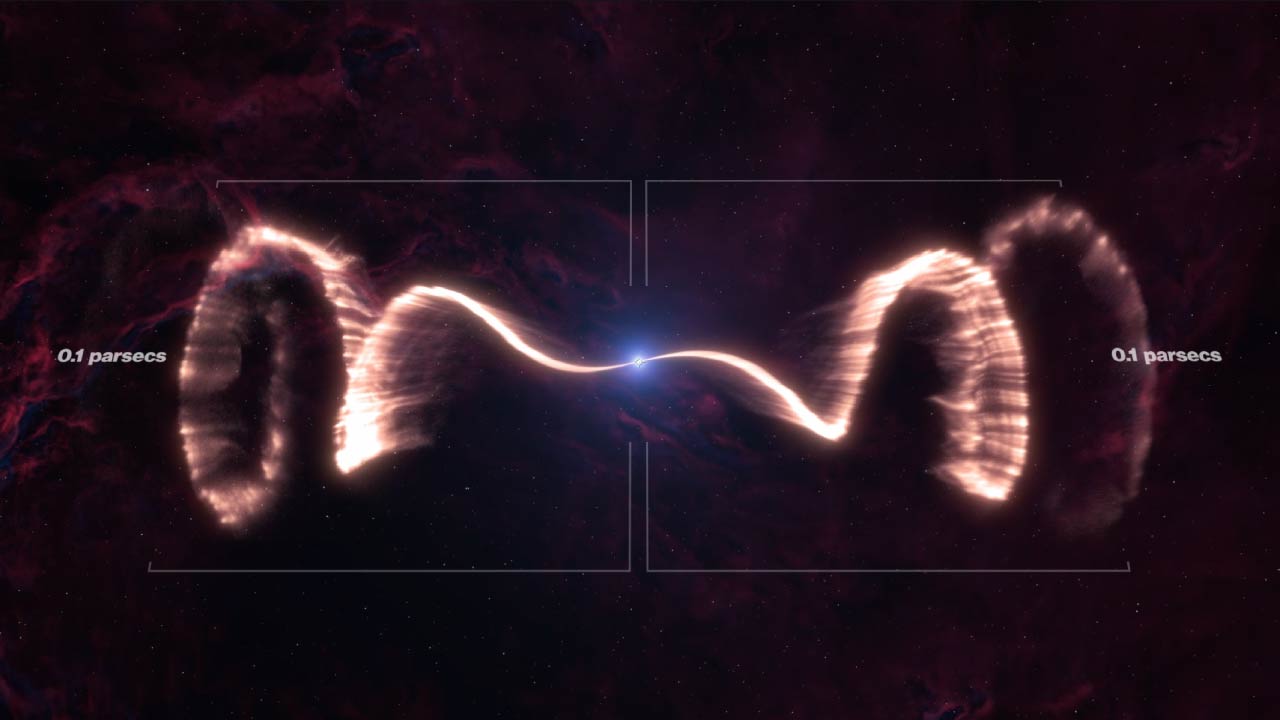
Strange jets of the microquasarProject type
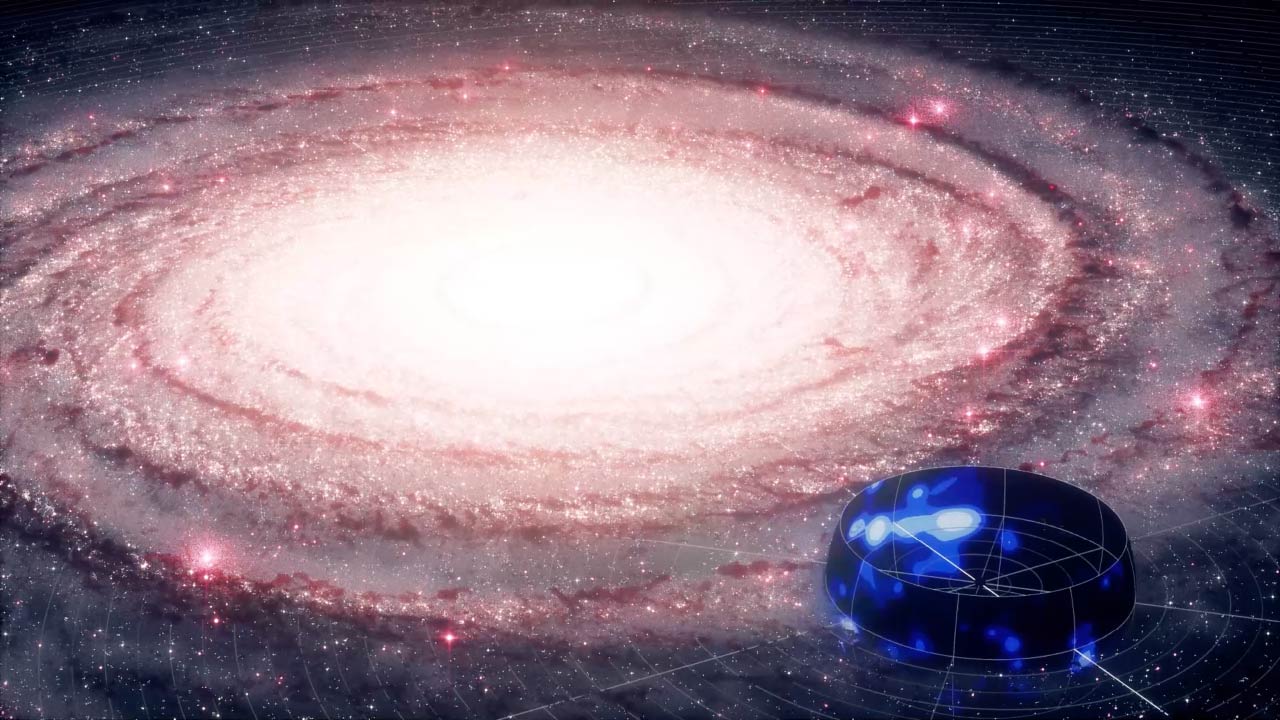
Milky Way In Neutrino LightProject type
Vela PulsarProject type
Lasers deflected using sound wavesProject type
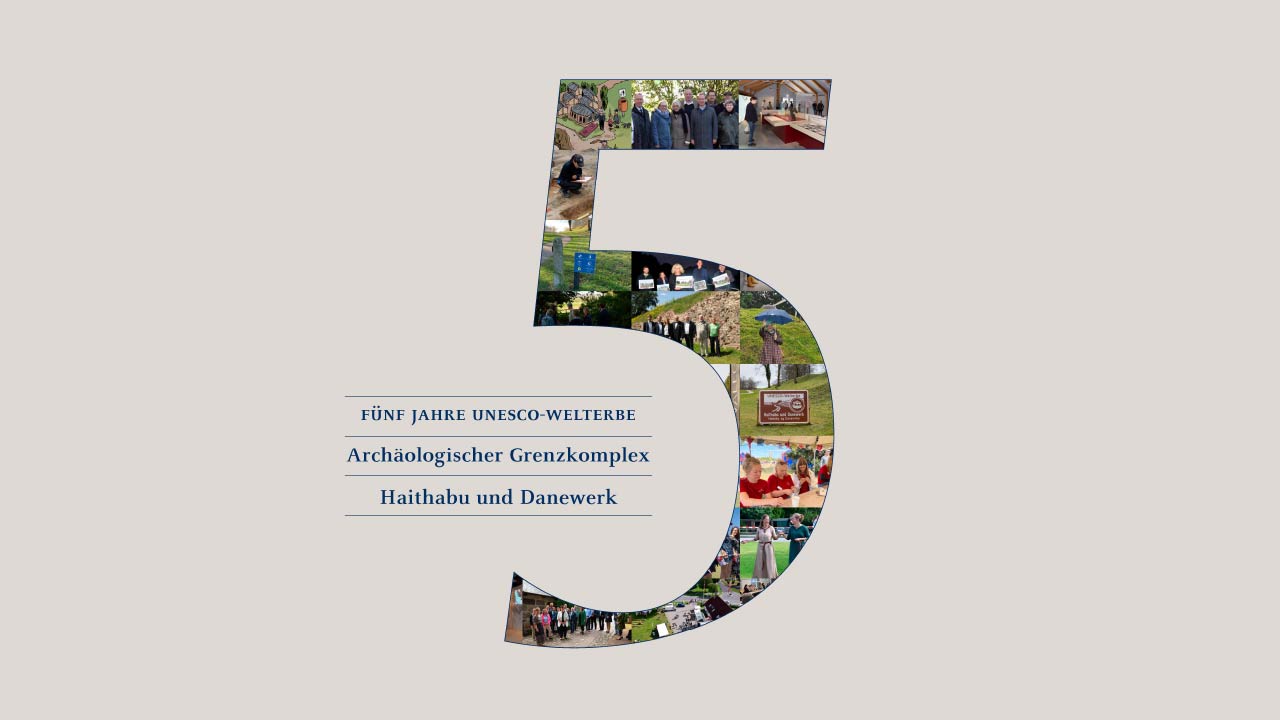
5 Years World HeritageProject type
Archaeology ConferenceProject type
IceCube AR CardProject type
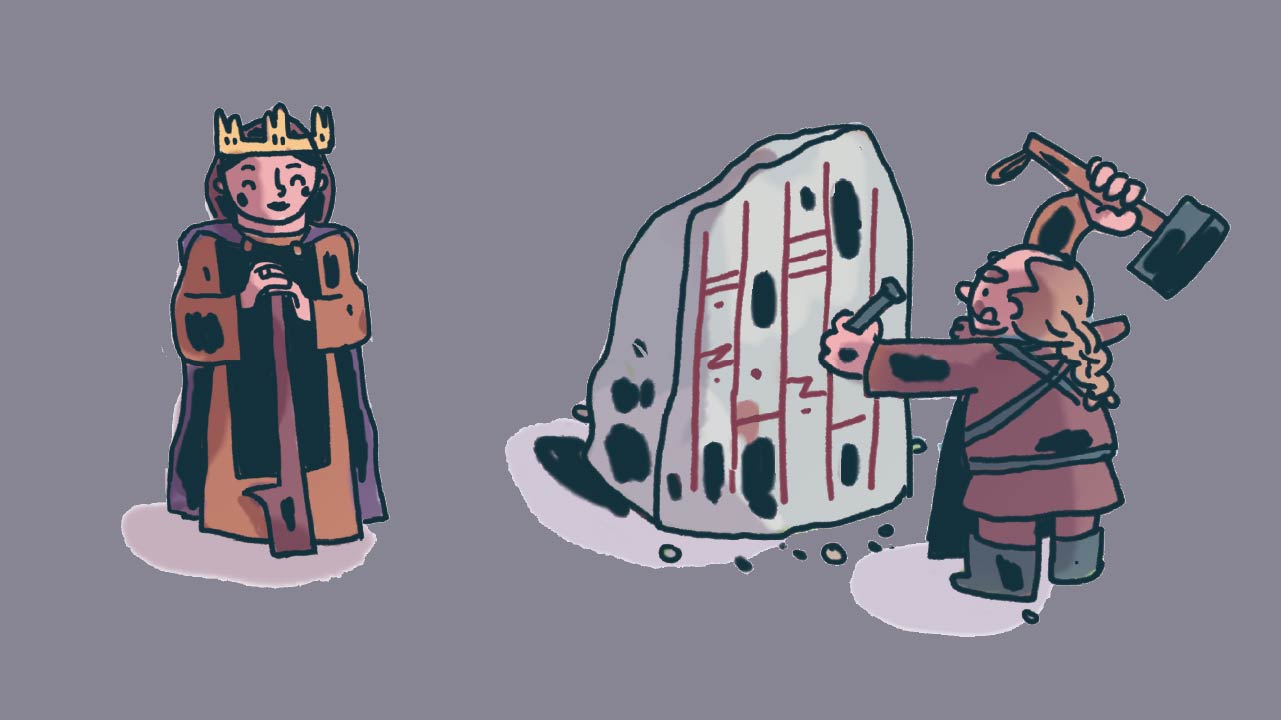
Who were the vikings?Project type
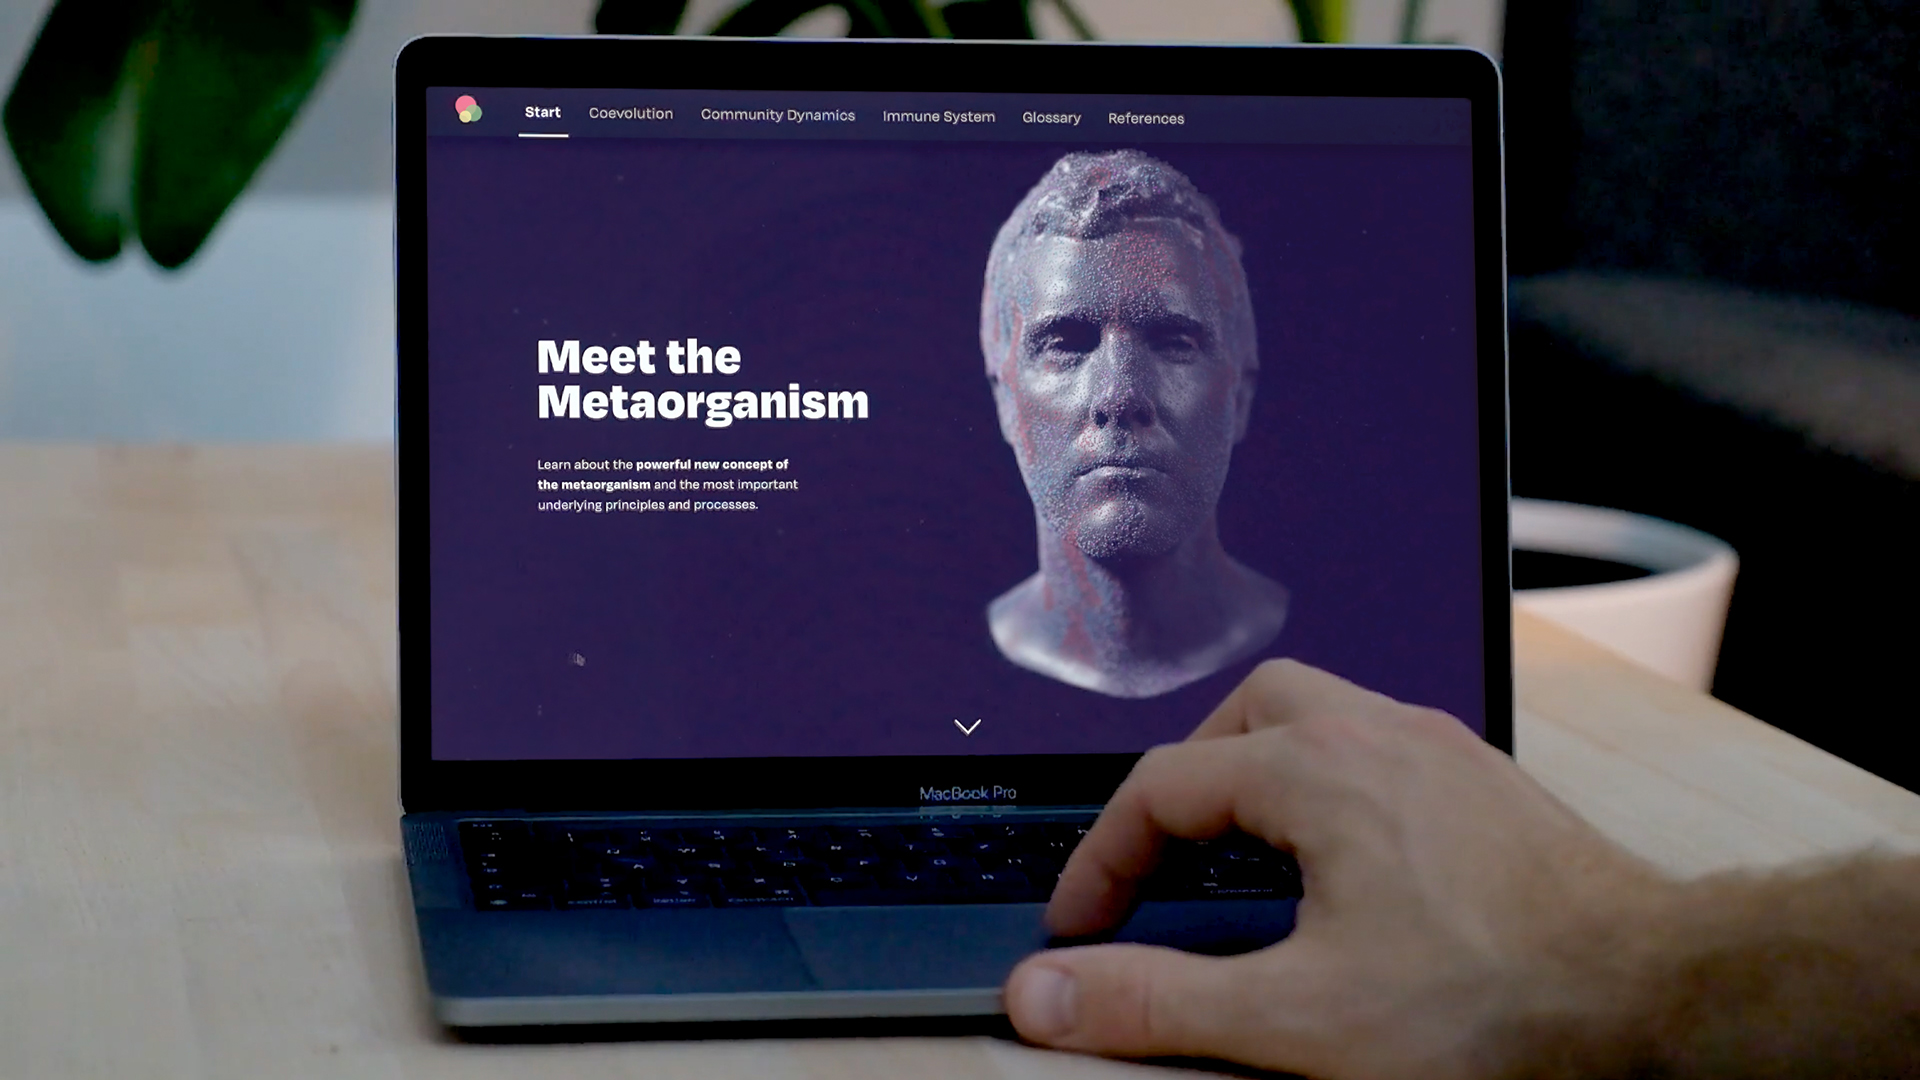
Meet the MetaorganismProject type
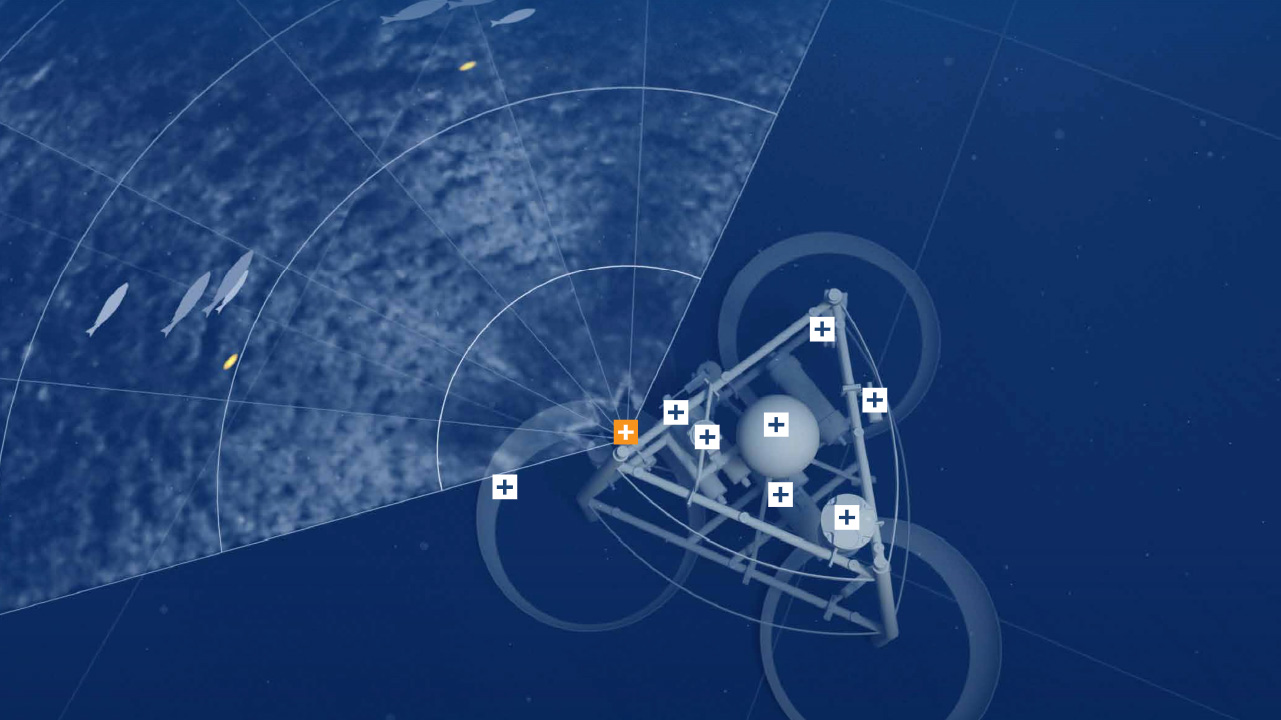
UFO: Underwater Fish ObservatoryProject type
Archaeological News S-H 2022Project type
A Window into the PastProject type
Single Cell Center WürzburgProject type
KalderaProject type
PETRA III – protein crystallographyProject type
Viking WalksProject type
HIBEF LaserProject type
Tidal Disruption Event: Dust EchoProject type
Icon PostersProject type
Danevirke Archaeology BlogProject type
Radio pulsationProject type
Ventus: Wind on RoadsProject type
UNESCO World heritage: Information signsProject type
Tidal Disruption EventProject type
Gamma Ray BurstsProject type
Pop-up card: Metaorganism SpongeProject type
Nanoparticle at workProject type

Laser-Plasma-AcceleratorProject type
Dark Matter and ALPS IIProject type
Nova outburst illustrationProject type
Guideline: Cultural heritage under waterProject type
DAK Congress 2020coming soon
Marine MicrobiologyProject type
World Heritage: Mixed Media WallProject type

Multimessenger MicrositeProject type
Digital MetaProject type
Dynamic PlanetProject type
TsunamiProject type
GenexpressionsProject type
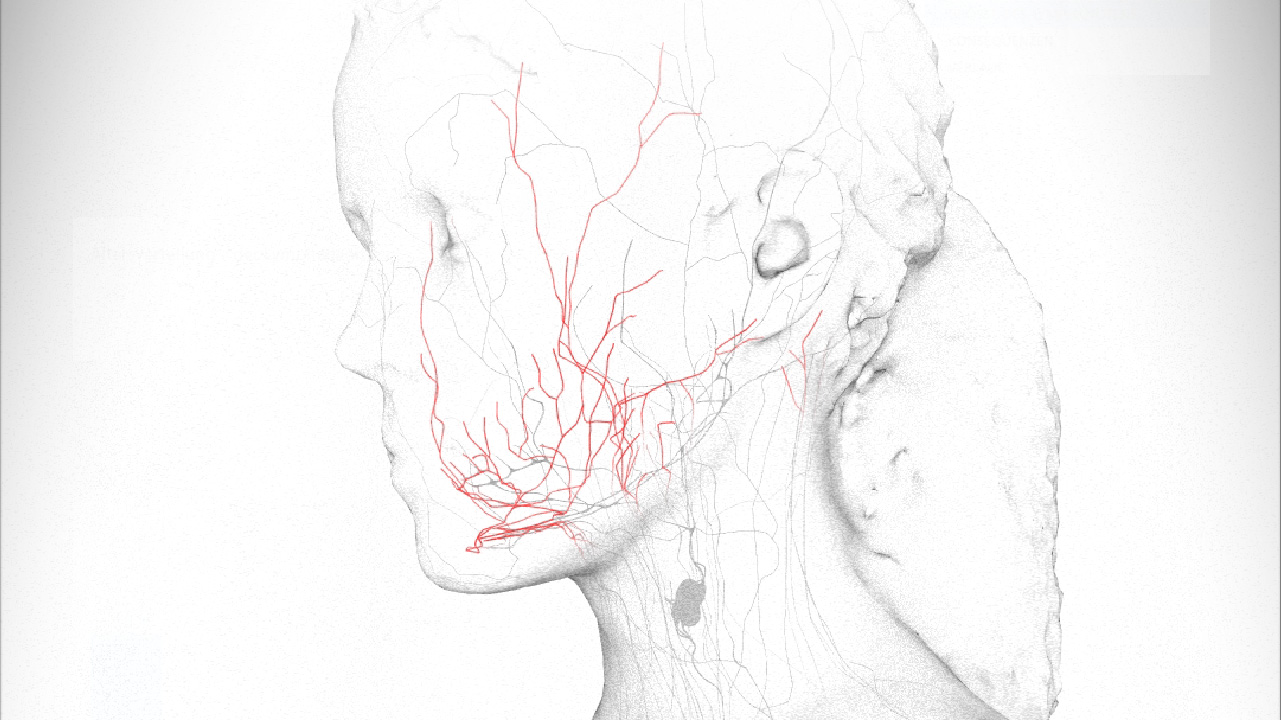
Lymphatic SystemProject type
Next Generation Scientific PosterProject type